
SHIB has seen a 3% weekly price drop but analysts predict a parabolic rally amid a massive token burn event.
Canine-themed meme coin Shiba Inu SHIB $0.000006 24h volatility: 4.3% Market cap: $3.38 B Vol. 24h: $163.41 M is currently trading near $0.00001220, down around 3% in the past week, yet analysts are pointing to a potential 17x surge.
This optimism comes as the token’s burn rate went up by over 6,260% in just 24 hours.
According to data from Shibburn, more than 4.55 million SHIB tokens were permanently destroyed in the past day.
In total, over 410.75 trillion SHIB have been burned since launch, reducing the circulating supply to about 589.24 trillion tokens.
HOURLY SHIB UPDATE$SHIB Price: $0.00001221 (1hr -0.02% ▼ | 24hr -1.48% ▼ )
Market Cap: $7,198,389,042 (-1.56% ▼)
Total Supply: 589,247,727,081,577TOKENS BURNT
Past 24Hrs: 4,559,620 (201207.73% ▲)
Past 7 Days: 6,445,248 (16.16% ▲)— Shibburn (@shibburn) September 4, 2025
A sudden spike in SHIB burn rate often leads to upward pressure on its price. The principle is straightforward: shrinking supply combined with steady or rising demand generally drives an asset’s value higher.
Currently, SHIB holds a market capitalization of $7.2 billion, while its 24-hour trading volume is 15% down at $152 million, yet to capitalize on the burn activity.
Imminent SHIB Price Breakout Ahead?
On the daily chart, the top meme coin has been consolidating inside a symmetrical triangle since mid-July. This pattern often leads to a breakout, with price compression hinting at growing volatility ahead.

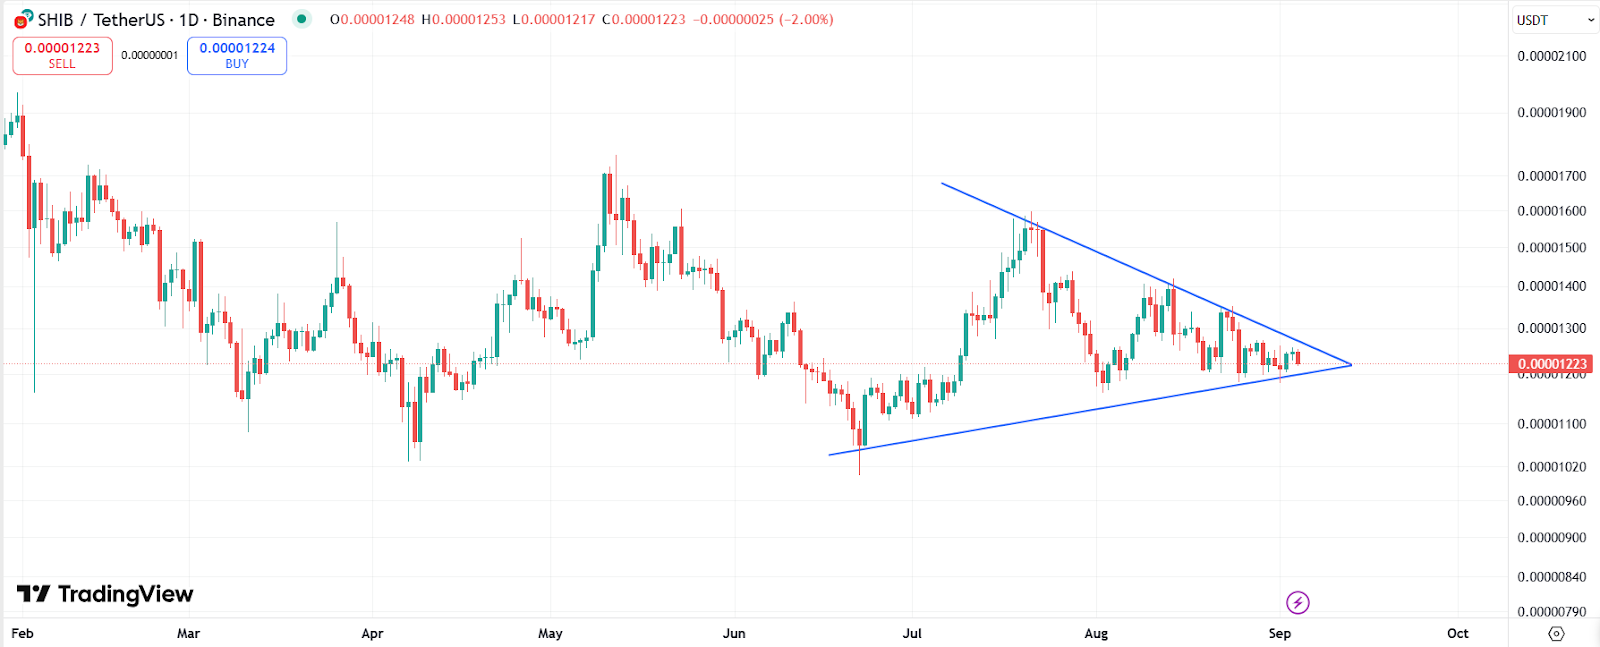
SHIB daily price chart with symmetrical triangle pattern. | Source: TradingView
If SHIB can decisively close above the upper resistance line near $0.0000130, the next upside targets could extend toward $0.0000150 and $0.0000200.
Popular analyst CryptoELITES recently forecasted that SHIB could enter a parabolic rally, with a potential price rise of up to 17x.
Such a move would take SHIB toward the $0.0002 region, a level last considered achievable during the 2021 meme coin frenzy.
SHIBA Target: 17x#SHIB $SHIB #Shib $Shib pic.twitter.com/ER7HT6ldXB
— CryptoELlTES (@CryptooELITES) September 3, 2025
On the 4-hour SHIB price chart, the Bollinger Bands are tightening, signaling a potential breakout in either direction.
Currently, price hovers near the middle band (20-day SMA), suggesting indecision among traders.

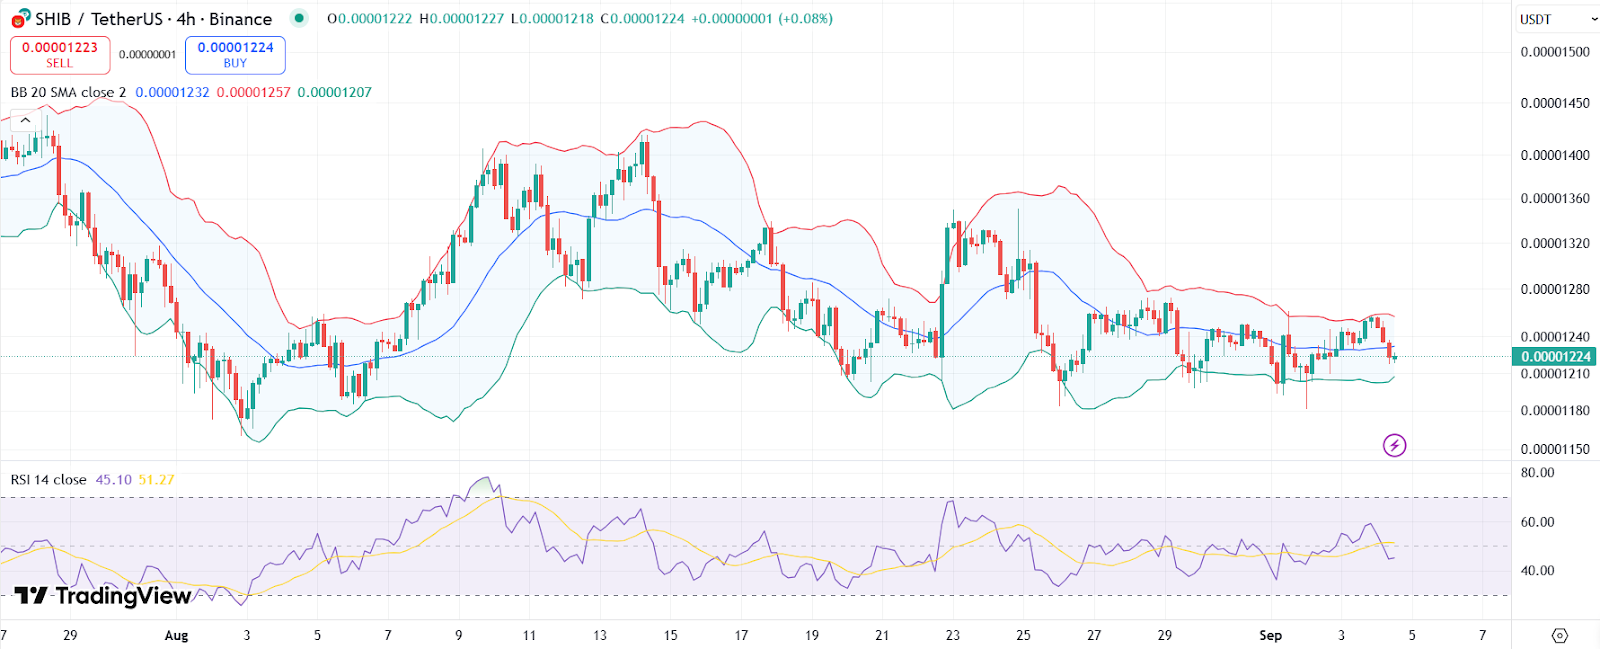
SHIB 4-hour price chart with the RSI and Bollinger Bands. | Source: TradingView
Meanwhile, the RSI is also sitting in neutral territory, leaving room for strong moves both ways. If the indicator pushes above 55, a bullish scenario could send SHIB to reclaim resistance at $0.0000128 and $0.0000135.
Meanwhile, the MACD indicator shows narrowing histogram bars with the signal line crossing close to the baseline.
This setup often results in a momentum shift. Traders should watch key support levels around $0.0000120 and $0.0000115.
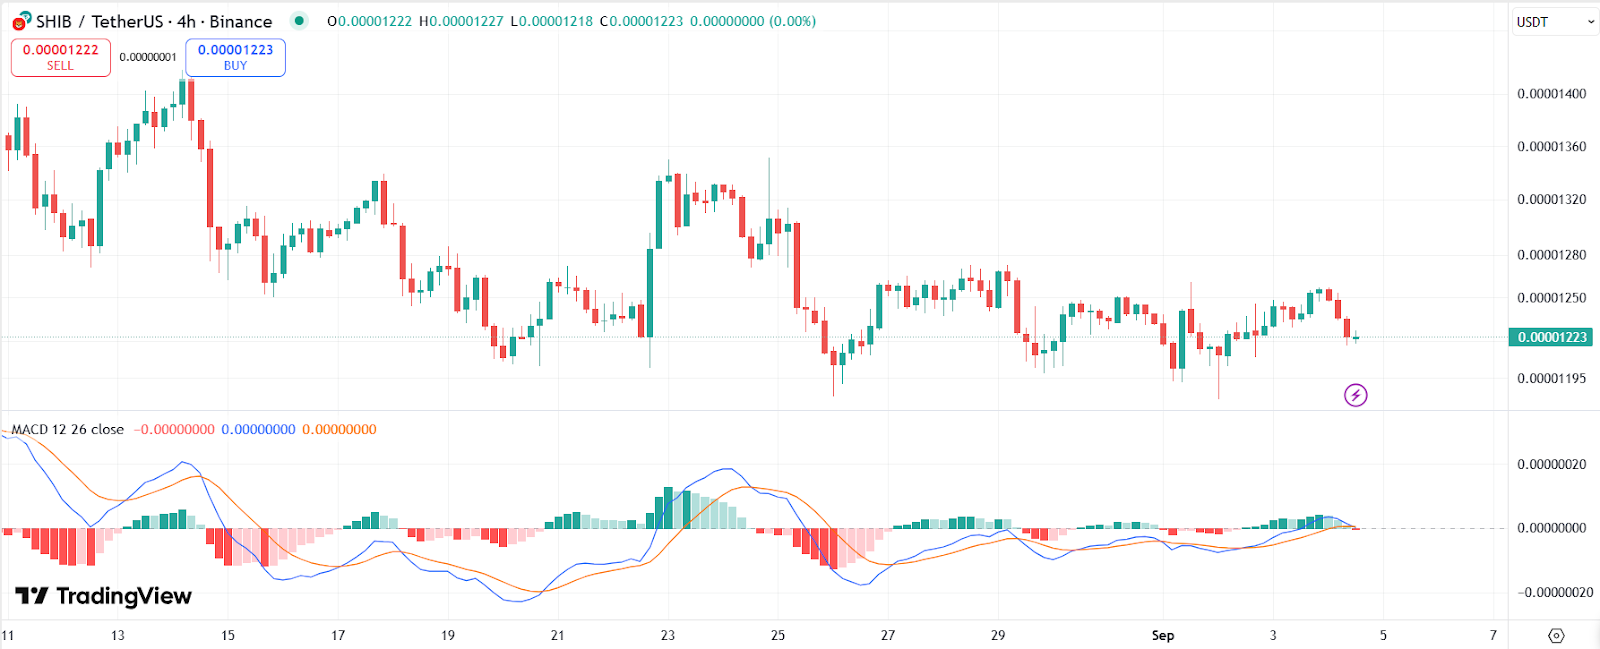
SHIB 4-hour price chart with the MACD. | Source: TradingView