
A breakdown at the demand level of $0.09 may be a short position with good candle pattern as confirmation for entries. Traders are advised to be patient before taking any position.
Key Highlights:
- Stellar price is consolidating;
- the bears were in control of the XLM market;
- XLM price will breakout soon.
XLM/USD Price Long-term Trend: Bearish
Supply levels: $0.13, $0.17, $0.21
Demand levels: $0.09, $0.06 $0.04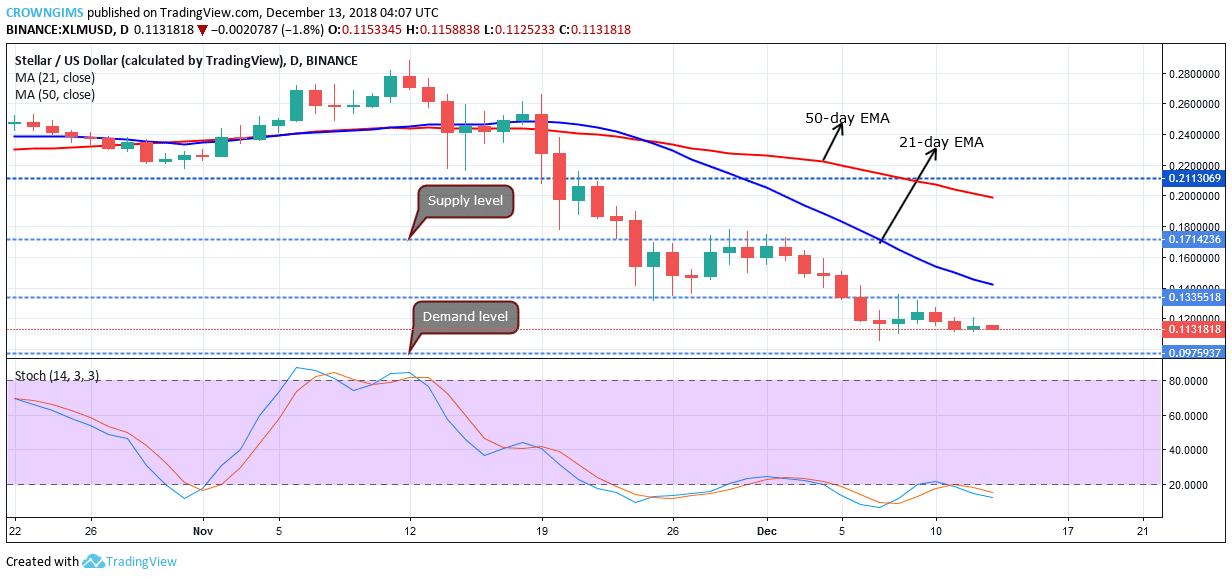

On December 5, the Bears’ momentum broke the former demand level $0.13 downside and the coin was exposed to the demand level of $0.09. The crypto has been consolidating since last week between the supply level of $0.13 and the demand level of $0.09.
The Stellar price is below the two EMAs, which implies bears’ pressure. The stochastic oscillator period 14 is in the oversold region and its signal points down at around 18levels. This suggests further downward price movement in the long-term. A breakout at the supply level of $0.13 may be considered for a long position while a breakdown at the demand level of $0.09 may be a short position with good candle pattern as confirmation for entries.
Traders are advised to be patient before taking any position.
XLM/USD Price Medium-term Trend: Ranging
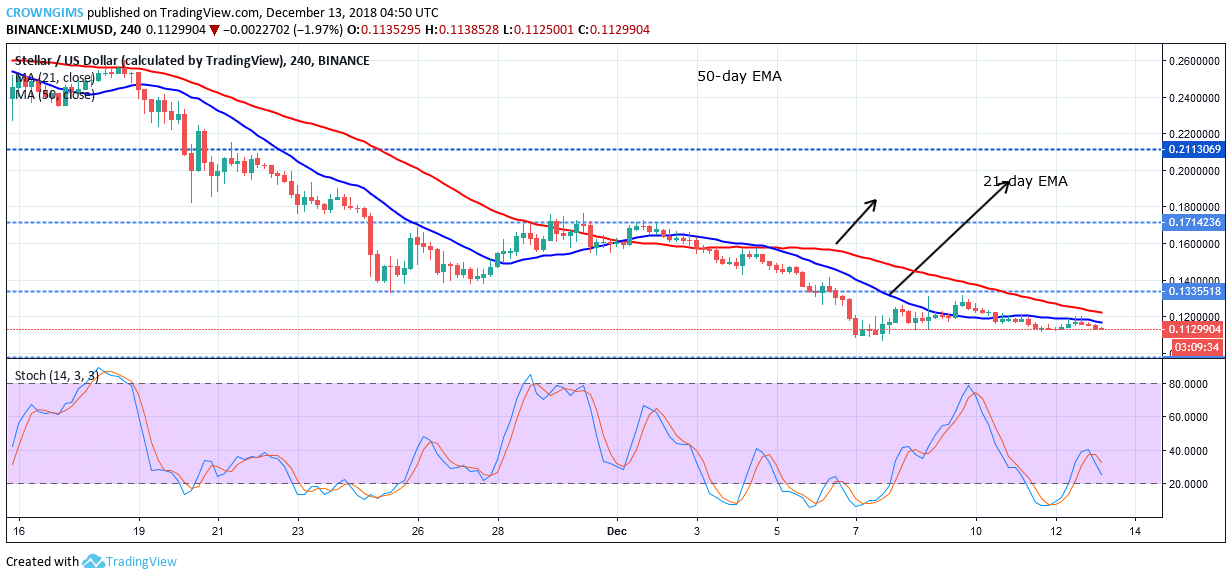
Stellar price is ranging in between and below 21-day EMA and 50-day EMA, the two EMAs are closed which indicates that consolidation is ongoing. The Stochastic Oscillator period 14 is above 20 levels pointing down, which implies further selling of XLM price.
next