
Further increase of the bears’ pressure may push the coin to its previous low and in case the bulls defend this level of $0.09 Stellar price may have its resistance at $0.13 price level.
Key Highlights:
- The bears hold tight to Stellar market;
- XLM price is consolidating below $0.10 price level;
- the coin is trading below the two EMAs.
XLM/USD price Long-term Trend: Bearish
Supply levels: $0.10, $0.12, $0.13
Demand levels: $0.09, $0.06 $0.05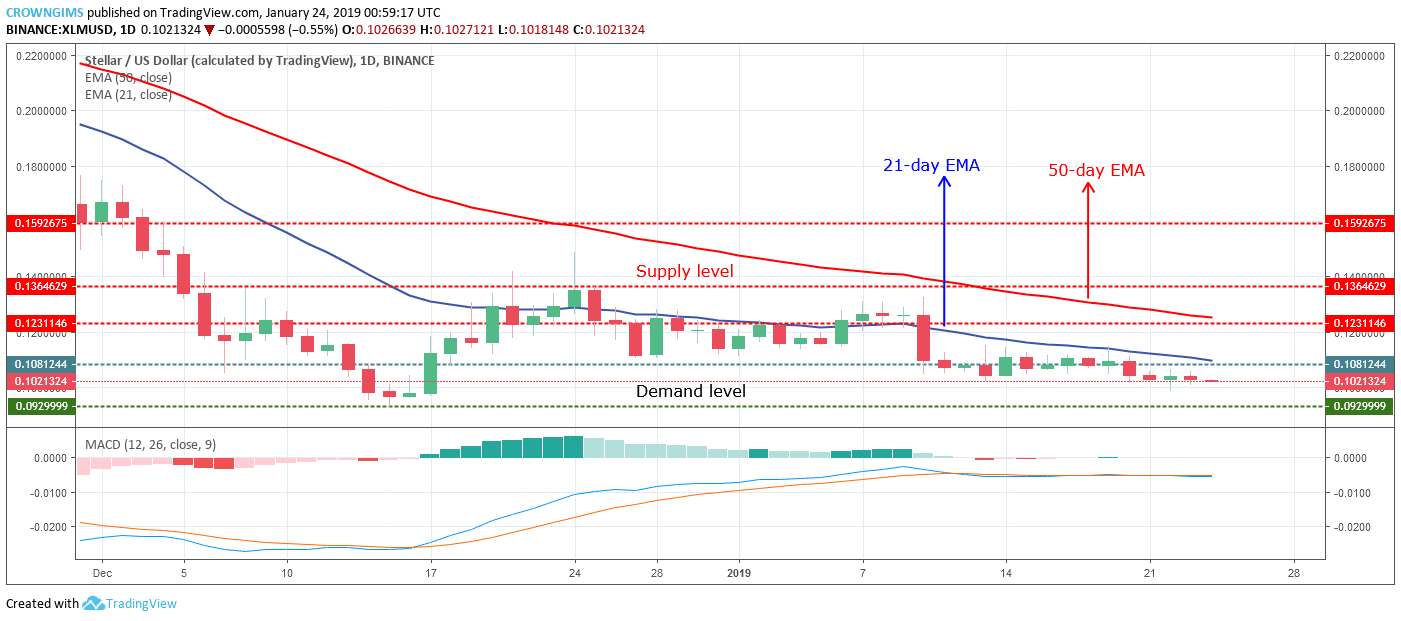

The bearish pressure is gradually increasing as the daily opening market candle is bearish and the coin is under the 21-day EMA while 50-day EMA is above the two which implies that the bears were still in control of the market. The MACD with its histogram is horizontally flat on the zero levels and its signal lines interlocked to each other flat, showing no direction which indicates that consolidation is ongoing and may continue for a while.
Further increase of the bears’ pressure may push the coin to its previous low and in case the bulls defend this level of $0.09 Stellar price may have its resistance at $0.13 price level.
XLM/USD Price Medium-term Trend: Bearish
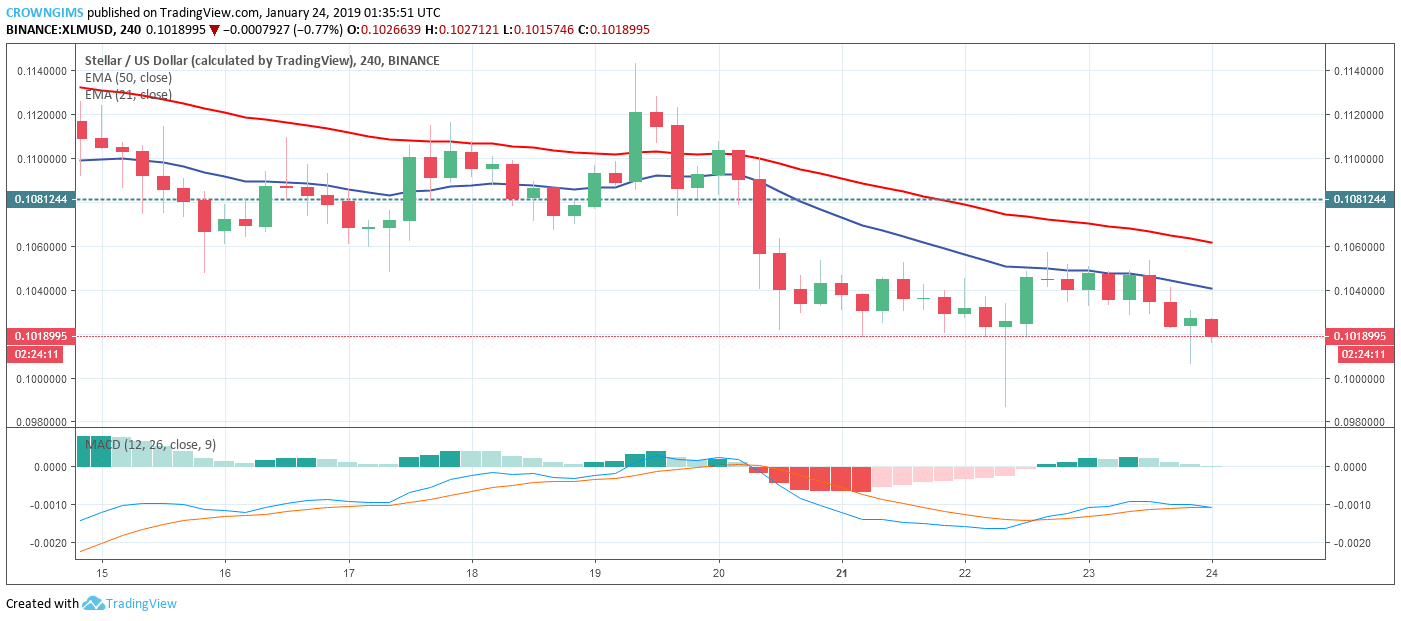
The MACD with its histogram above zero levels and its signal lines below zero levels bending downward indicates sell signal. The 50-day EMA remains above the 21-day EMA with the coin trading below the two EMAs as an indication of bears’ momentum in the Stellar market.
next