
In case the bulls defend the demand level of $0.07 and increase their momentum, there will be a change of trend to the north side and Stellar price may incline towards $0.10 supply level. If not downtrend continues.
Key Highlights:
- There was a price retracement on the 4-Hour chart;
- Stellar price is consolidating below $0.09 price level;
- further price declination is anticipated.
XLM/USD Price Long-term Trend: Bearish
Supply levels: $0.09, $0.10, $0.12
Demand levels: $0.07, $0.06, $0.05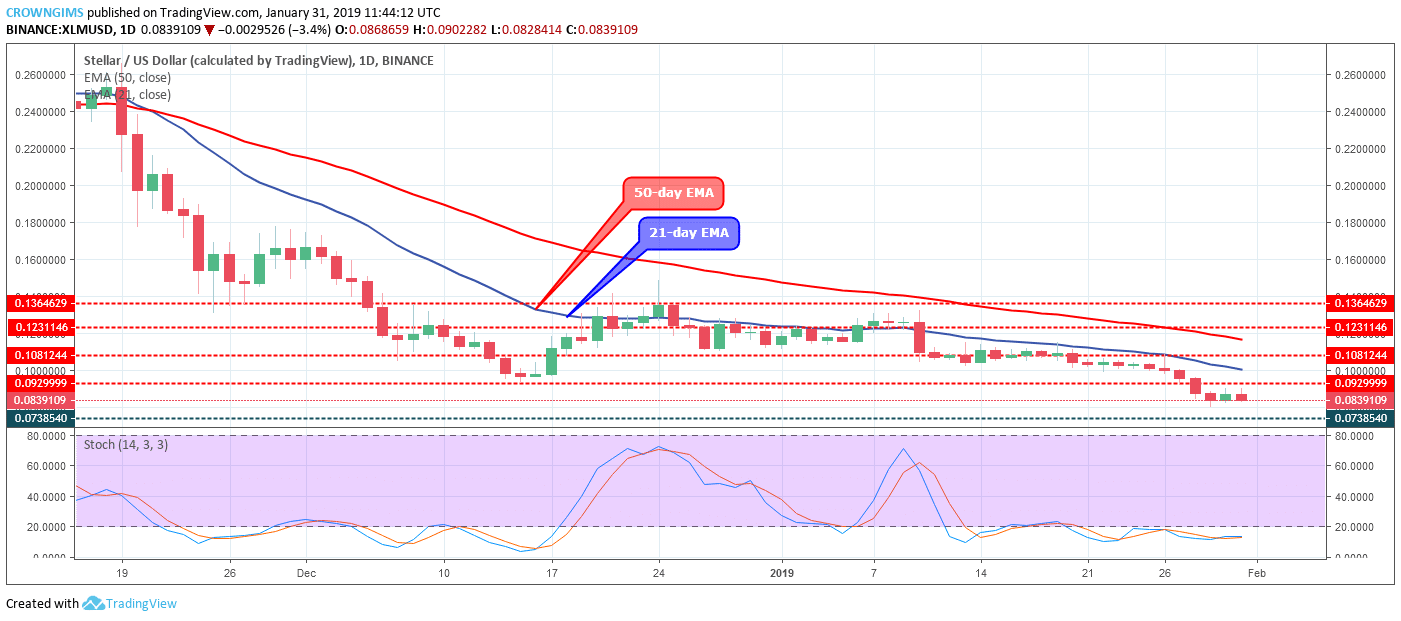

More bearish candles were emerging as a sign of increasing bearish momentum. Stellar price still found ranging below the two EMAs. The Stochastic Oscillator period 14 is below 20 levels (oversold region) and the signal lines horizontally flat at the level confirm the ongoing consolidation movement on the XLM market which may be for a short period of time.
In case the bulls defend the demand level of $0.07 and increase their momentum, there will be a change of trend to the north side and Stellar price may incline towards $0.10 supply level. If not downtrend continues.
XLM/USD Price Medium-term Trend: Bearish
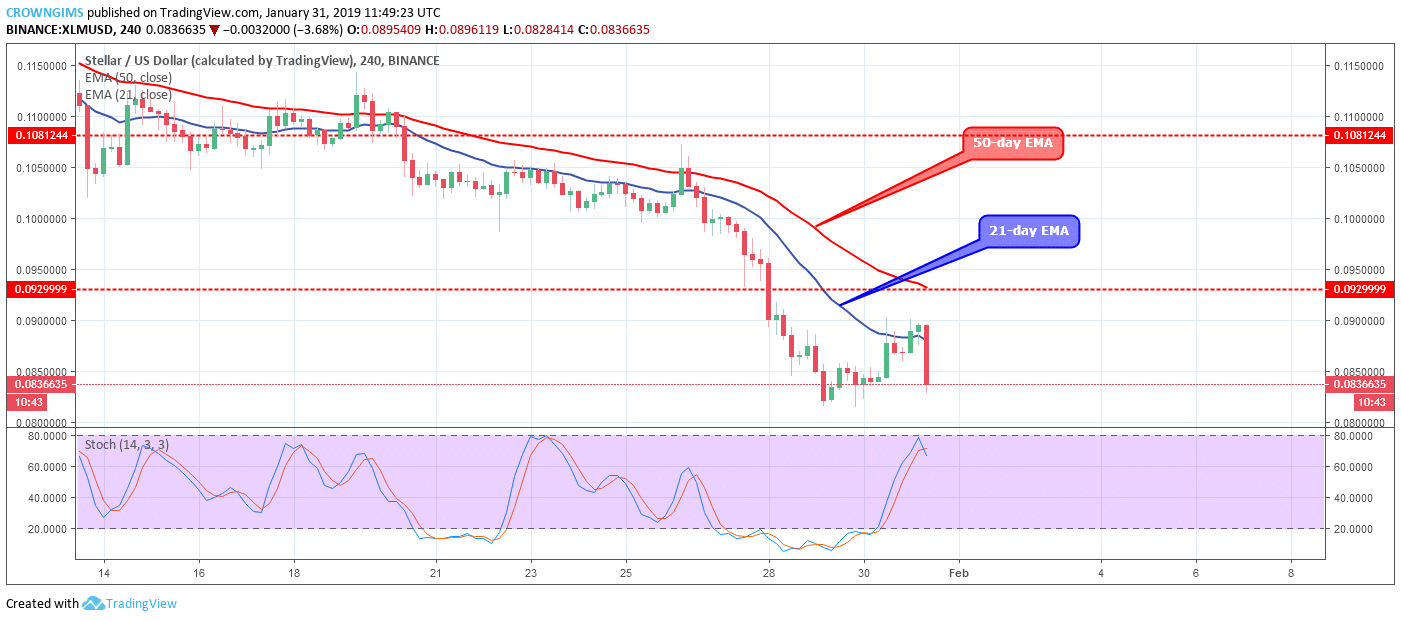
The Stochastic Oscillator period 14 is at 50 levels with its signal lines pointing down connotes sell signal. The 50-day EMA remains above the 21-day EMA with Stellar price trading below the two EMAs as an indication that the bears’ momentum in the XLM market is increasing. Further decrease in the price of XLM is anticipated.
next