XRP price led the altcoin market recovery with a 10% rally to $2.20, driven by easing geopolitical tensions following the Iran-Israel ceasefire.
Ripple’s native crypto XRP XRP $1.41 24h volatility: 1.3% Market cap: $86.61 B Vol. 24h: $2.16 B has outperformed the rest of the altcoins market recovery following ceasefire talks in the Iran-Israel conflict, rising 10% and reaching $2.20.
Today’s XRP price rally is driven by a combination of factors including geopolitical developments, whale accumulation, optimism around the XRP ETF, and progress in the Ripple lawsuit.
XRP Price Rallies as Iran-Israel Reach Ceasefire Agreement
On Monday, both Iran and Israel approved the ceasefire agreement mediated by US President Donald Trump. Israeli Prime Minister Benjamin Netanyahu announced Israel’s agreement to a truce following a statement from the U.S. President Donald Trump.
Similarly, Iranian Foreign Minister Abbas Araghchi pledged that Iran would cease fire on the condition that Israel does the same.
With the easing of geopolitical tensions, risk-on market sentiment picked up quickly, boosting investors’ appetite for altcoins and driving XRP’s price higher. The accumulation by XRP whales has also supported this Ripple price rally.
According to Glassnode data, the total supply held by addresses with 10,000 to 100,000 XRP has steadily grown since December 2024, even amid geopolitical tensions such as the recent Israel-Iran conflict.
This cohort now controls over 7.34 billion XRP, up from approximately 6.8 billion a year ago, indicating a pattern of strategic dip-buying and sustained confidence in XRP’s long-term potential.

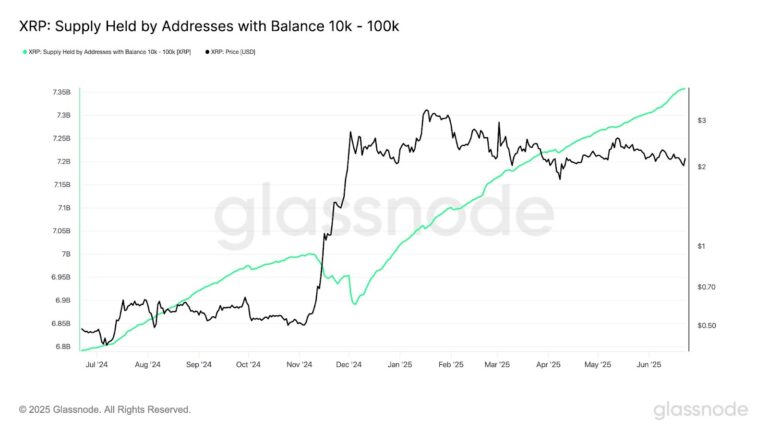
XRP Holdings by Whales – Source: Glassnode
Their continued accumulation likely acted as a stabilizing factor during recent market turbulence, enabling XRP to recover more swiftly as risk appetite improved across broader markets.
Meanwhile, with a 90% chance of SEC approval for a spot XRP ETF, investor optimism remains strong.
Where Is Ripple Price Moving From Here?
XRP’s rally today stemmed from a rebound at a critical support zone between $1.82 and $1.92, marked by its 50-week exponential moving average (EMA) and the lower boundary of its descending triangle pattern.
This same support level previously triggered a 65% jump in early April, propelling XRP toward the triangle’s upper trendline.

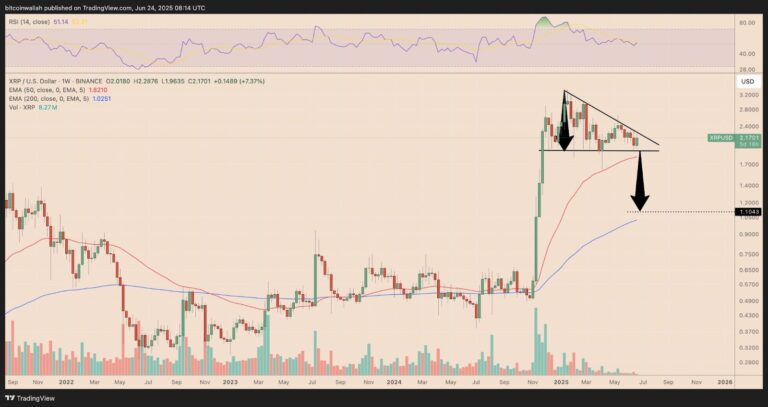
XRP price descending triangle pattern – Source: TradingView
However, descending triangles are traditionally viewed as bearish reversal patterns when forming in an uptrend. A decisive break below the lower trendline could push XRP down to $1.10.
The bearish outlook would be invalidated if XRP manages to break above the triangle’s upper trendline resistance.
next