
PEPE surged 10%, reaching $0.00000869 amid whale accumulation, with a crypto whale withdrawing 2 trillion PEPE coins from Binance over the past week.
PEPE coin PEPE $0.000003 24h volatility: 3.8% Market cap: $1.45 B Vol. 24h: $358.37 M price has staged a strong 10% upside today amid the broader crypto market recovery, trading at $0.00000869 with its market cap at $3.75 billion.
Today’s rally comes with the overall upside in the memecoin sector, and Dogecoin DOGE $0.0989 24h volatility: 7.9% Market cap: $15.16 B Vol. 24h: $1.64 B , Shiba Inu SHIB $0.000006 24h volatility: 8.9% Market cap: $3.48 B Vol. 24h: $175.35 M , and other peers stage gains between 5-10%. Also, massive PEPE whale activity could lead to further price action moving ahead.
PEPE Coin Price Rally to Continue Amid Whale Activity
Over the last week, a PEPE whale has been smartly scooping the supply, accumulating nearly 2 trillion PEPE from the open market. As of April 30, a crypto whale with $147 million worth of assets withdrew a staggering 1.5T PEPE coins from crypto exchange Binance. Earlier today, the same whale entity withdrew an additional 500 billion from Binance.
This whale just bought 500B $PEPE($4.36M) again and currently holds 2T $PEPE($17.42M).https://t.co/lj4QaP0DUW pic.twitter.com/sx7hOqkcKG
— Lookonchain (@lookonchain) May 8, 2025
Additionally, the CoinGlass data the PEPE open interest has shot up by 6.6% to more than $434 million, hinting at high trader interest for the meme coin. Furthermore, amid today’s PEPE price surge, the 24-hour liquidations have soared to $1.57 million, of which $1.45 million is in short liquidations.
A Look Into the Technical Chart Pattern
The PEPE coin chart forms a bullish engulfing candle and completes a morning star pattern, a classic indicator of potential trend reversal. PEPE has broken past the 23.60% Fibonacci retracement level at $0.00000823 and is now eyeing the key resistance at $0.0000090.
Additionally, the evolving trend reveals the formation of a cup and handle pattern, signaling the potential for further upside in the meme coin’s price trajectory.

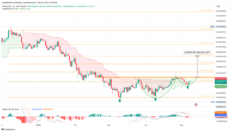
PEPE price chart | Source: TradingView
A confirmed daily candlestick close above the neckline will validate the breakout from the cup and handle pattern, potentially driving PEPE toward a price target of $0.000001465, aligning with the 61.80% Fibonacci level.
Trading above $0.0000075, PEPE maintains a bullish outlook as indicated by the Supertrend Indicator.
Meanwhile, the MACD and signal lines suggest an impending crossover, signaling a resurgence in bullish momentum. Conversely, if PEPE fails to break above the neckline, it may face another pullback, potentially retesting the support level at $0.0000075.
next