
Regarding the heatmap analysis, liquidity between the $50,000 and $48,000 range is critical for the next phase of Bitcoin price action.
Recent market indicators suggest that Bitcoin (BTC) may be on the verge of a short-term rebound following a period of significant overselling.
An analysis of various market metrics points to a potential shift in momentum, though caution remains warranted.
Weakening Downward Momentum
According to XBTManager, a contributor and on-chain analyst at CryptoQuant, several key metrics and indicators suggest that Bitcoin could be nearing a bottom after a roughly 30% drop from its peak of $70,000.
The Coinbase premium index, which reflects the difference between Bitcoin prices on Coinbase and other exchanges, has shown signs of weakening downward momentum. This shift suggests that demand may be starting to increase, potentially signaling an imminent reversal. However, the index indicates that while the bottom may be approaching, there could still be some further decline before a true rebound begins.

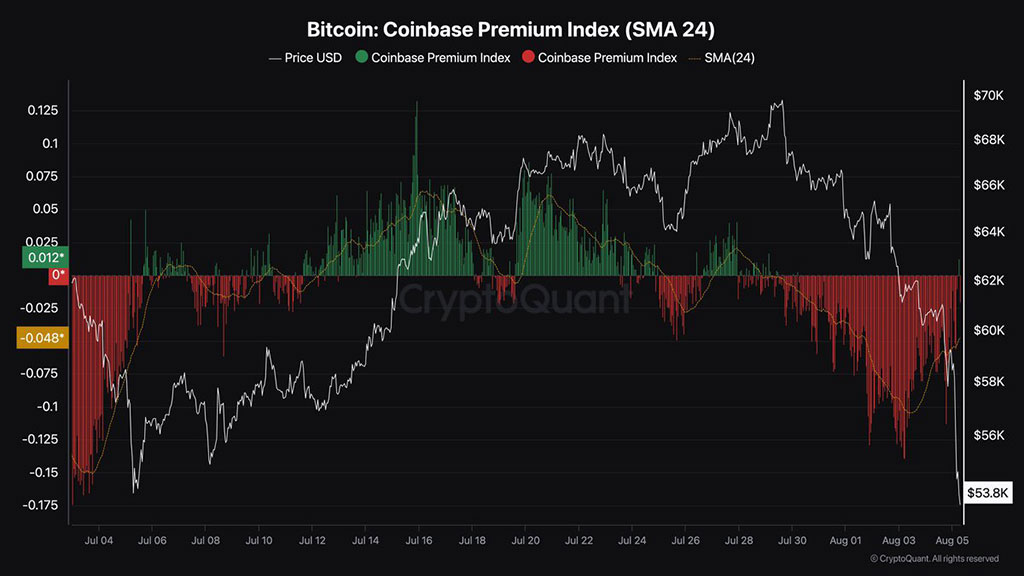
Photo: CryptoQuant
Current Market Conditions
Spot CVD (Cumulative Volume Delta) data highlights persistent selling pressure, with Binance showing oversold conditions and Bitfinex slightly shifting toward buying. Despite this, overall selling trends dominate. The Coinbase index reflects a trend of slight selling but with an overall upward inclination, indicating mixed signals in the market.
Perpetual contract selling pressure remains high, suggesting that the downward trend could persist unless we see significant strength in the market. However, open interest has decreased as many positions have closed, which could set the stage for a potential turnaround if buying strength returns.
The true retail long ratio is currently at 72, exerting continued downward pressure on Bitcoin prices. This figure highlights that individual investors are holding more long positions compared to whales. The whale versus retail delta stands at -5, reflecting a larger commitment from retail investors. This disparity could indicate a potential shift in market dynamics if whales begin to increase their long positions.
Regarding the heatmap analysis, liquidity between the $50,000 and $48,000 range is critical for the next phase of Bitcoin price action. The heatmap indicates that once these levels are cleared, a pullback might commence. Traders are advised to position themselves accordingly, keeping an eye on these liquidity zones for signs of a potential rebound.
Broader Market Context
The broader financial landscape also impacts Bitcoin’s price action. Recent turmoil in global stock markets, including historic losses in the Nikkei and significant declines in Nvidia stock, signals a period of heightened volatility.
Warren Buffett’s recent decision to reduce Berkshire Hathaway’s stake in Apple adds further pressure on stock markets, influencing investor sentiment across asset classes, including cryptocurrencies. In the US, the Federal Reserve’s recent actions and the possibility of an emergency rate cut could affect market stability.
Overall, while Bitcoin’s current metrics suggest a potential for a short-term rebound, the market remains in a fragile state with mixed signals. Traders should remain cautious, monitoring key levels and broader market influences as they navigate this period of uncertainty.
next