Bitcoin Cash Price Analysis: BCH/USD Trends of November 7–13, 2018

On Nov 7, 2018 at 8:41 am UTC by · 2 min read

Confirmation to the bulls’ takeover was seen as the next daily candle closed as bullish engulfing above the two EMAs.

Key Highlights:

  • Further increase in Bitcoin Cash price is certain;
  • bulls were in control of the BCH market;
  • price pullback is inevitable.

BCH/USD Price Long-term Trend: Bullish

Resistance zone: $655, $788, $919
Support zone: $568, $501, $410BCH/USD resume bullish trend. The cryptocurrency has been on the downtrend movement since May 7th, immediately after the Doji candle formation followed by the bearish engulfing candle. The 21-day EMA also crossed the 50-day EMA downside to confirm the bearish trend. Since then, the bears were in control of the Bitcoin Cash market. The coin found its lower low at $410 support zone on October 31.

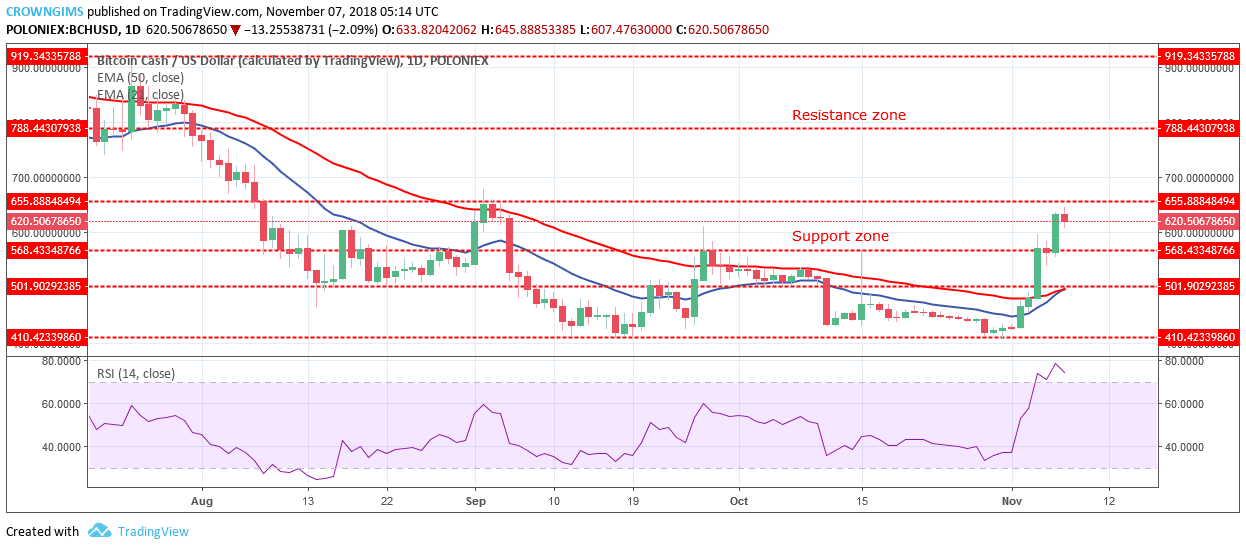
The bears lose pressure in this zone and the bulls gained momentum. The strong bullish pressure after the Doji formation at $410 in the support zone signaled the bulls returned. Confirmation to the bulls’ takeover was seen as the next daily candle closed as bullish engulfing above the two EMAs. Increased bullish momentum led to the breakup of the former resistance zones of $501 and $568.

BCH price is above the two EMAs and 21-day EMA is crossing the 50-day EMA upside to confirm the bulls’ pressure and certainty of BCH price increase. Meanwhile, RSI period 14 is at the 80 levels ( overbought zone ) and its signal line point down indicates sell signal which may be a pullback which is necessary for the market correction as this will guarantee uptrend continuation.

BCH/USD Price Medium-term Trend: Bullish

On the 4-Hour chart, BCH is in the bullish trend. The bulls came into the market on November 2, with full force, this is confirmed by the formation of massive strong bullish candles which made the price to go up, broke the former resistance zones of $501 and $508.

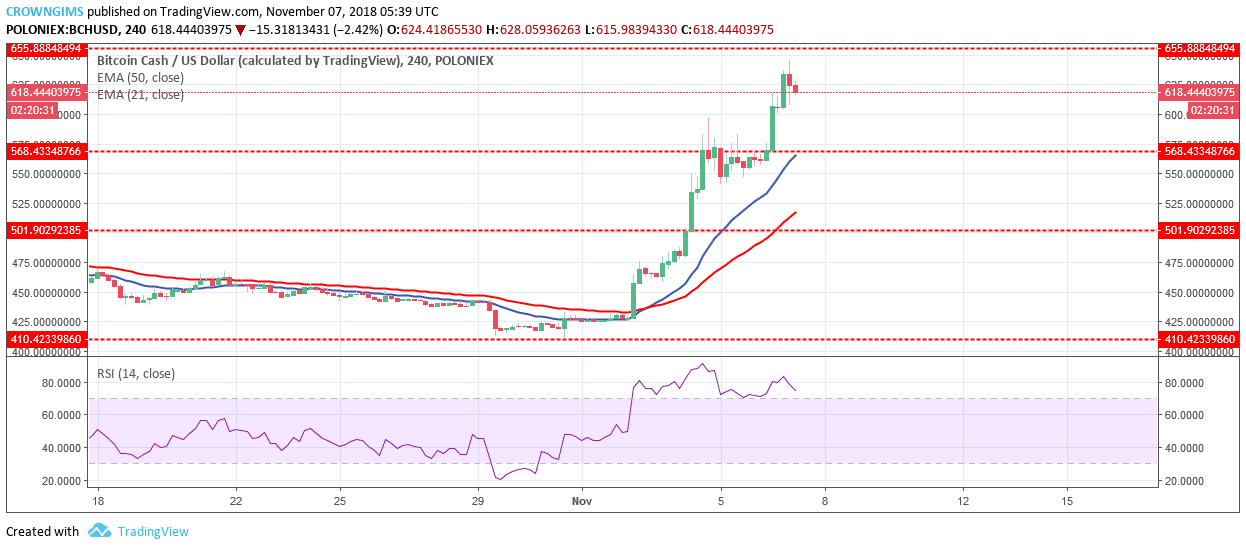
BCH price is above the 21-day EMA and 50-day EMA which is an indication of a bullish trend. The RSI period 14 is at 80 levels (overbought zone) and its signal line points toward south connote sell signal which may be a pullback.

Share:

Related Articles

Bitcoin’s Price Drop to $64,000 Leads to $210 Million Liquidations in One Day

By April 25th, 2024

Bitcoin’s decline to $64,000 had a widespread impact on the overall market, particularly affecting altcoins, which experienced larger drops than BTC. 

The Next Big Crypto: Poised to Outshine Bitcoin Cash and XRP?

By April 16th, 2024

Is DTX Exchange the future of crypto? Explore its potential to outshine Bitcoin Cash and XRP in the ever-evolving digital currency space.

Could Large Crypto Investors Drive Bitcoin’s Value to $75,000? Bitcoin Cash and Algotech See Significant Gains

By April 4th, 2024

Bitcoin (BTC), Bitcoin Cash (BCH), and Algotech (ALGT) continue to deliver unmatched results for investors in the bullish market.

Exit mobile version