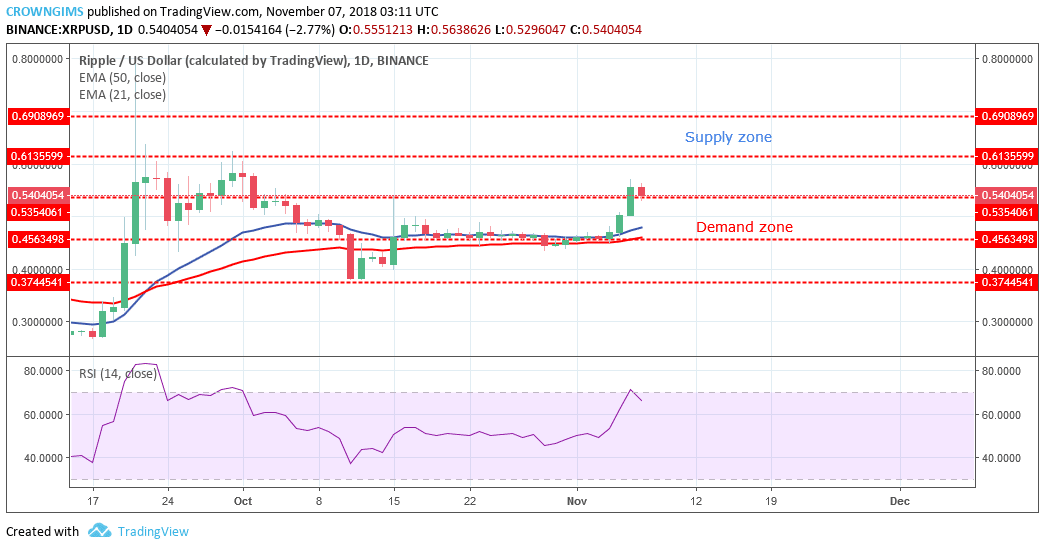
Supply levels: $0.61, $0.69, $0.75
Demand levels: $0.53, $0.45, $0.37XRP/USD is bullish in its long-term medium outlook. On October 11, XRP price reached the lower demand level of $0.37 by the strong pressure of the bears with the formation of a strong bearish candle but could not break down the demand zone. The Bulls return the XRP price above $0.45 with the formation of inside bar candle that indicates the bulls’ momentum. It then consolidated for more than ten days.
On November 5, the bulls enter the market with high momentum and pushed the pair to the north with the formation of massive bullish candle that broke the former supply zones of $0.53 and exposed the supply zone of $0.61. Currently, there is a sign of price increase rejection which may be price retracement as the daily candle on the daily chart is bearish. In case, the demand zone of $0.53 holds the XRP will rally to the north and the supply zone of $0.61 will be the next target.
XRP price is above 21-day EMA and the 50-day EMA which indicates that the uptrend is ongoing. However, RSI period 14 is at the 70 level pointing towards the south indicates that there are possibilities for downward movement.
XRP/USD Price Medium-term Trend: Bullish
On the 4-H chart, XRP is bullish. The XRP price broke out from the consolidation phase by the pressure of the bulls and the supply zone of $0.53 was broken to the upside. The XRP price increase was rejected by the bears and it is falling towards the demand zone of $0.53.
21-day EMA has crossed the 50-day EMA upside and the price is above 21-day EMA and 50-day EMA which indicates uptrend is ongoing.
In case the bears increase their pressure further and break the demand level of $0.53 downside, the demand level of $0.45 will be exposed. The RSI period 14 is at overbought zone with its signal line pointing to the south indicate sell signal.
Azeez Mustapha is a specialist in Computer Studies (including DTP), Forex and Crypto trading professional. Being expert technical and currency analyst, as well as experienced fund manager and author of several books, Azeez places strong focus on crypto market studies conducting comprehensive price analyses and sharing forecasts of presumptive market trends.
 XRP/USD is bullish in its long-term medium outlook. On October 11, XRP price reached the lower demand level of $0.37 by the strong pressure of the bears with the formation of a strong bearish candle but could not break down the demand zone. The Bulls return the XRP price above $0.45 with the formation of inside bar candle that indicates the bulls’ momentum. It then consolidated for more than ten days.
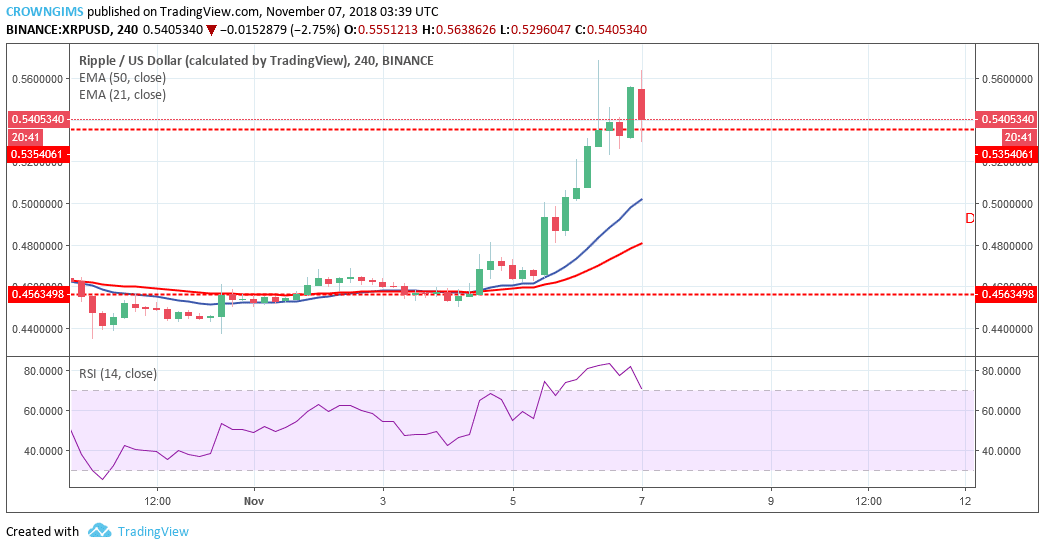 On the 4-H chart, XRP is bullish. The XRP price broke out from the consolidation phase by the pressure of the bulls and the supply zone of $0.53 was broken to the upside. The XRP price increase was rejected by the bears and it is falling towards the demand zone of $0.53.