Bitcoin Cash Price Analysis: BCH/USD Trends of November 14–20, 2018

Updated on Apr 28, 2022 at 11:31 am UTC by · 2 mins read

Should the bears maintain or increase their pressure, the support zone of $501 will be broken and expose the support zone of $410 for Bitcoin Cash price to find its low.

Key Highlights:

  • Bears took over the Bitcoin Cash market;
  • there is a probability of a further decrease in BCH price;
  • price pullback is inevitable.

BCH/USD Price Long-term Trend: Bearish

Resistance zone: $568, $655, $788
Support zone: $501, $410, $310The cryptocurrency is bearish on the long-term outlook. On November 6, Bitcoin Cash price found its high at the resistance zone of $655. The Bulls lose the pressure and were unable to break up the resistance zone of $655. The bears took over the BCH market; this is clearly seen on the chart with the formation of bearish candles that led to the broken down of the last week support zone of $568 down to the $501 price level.

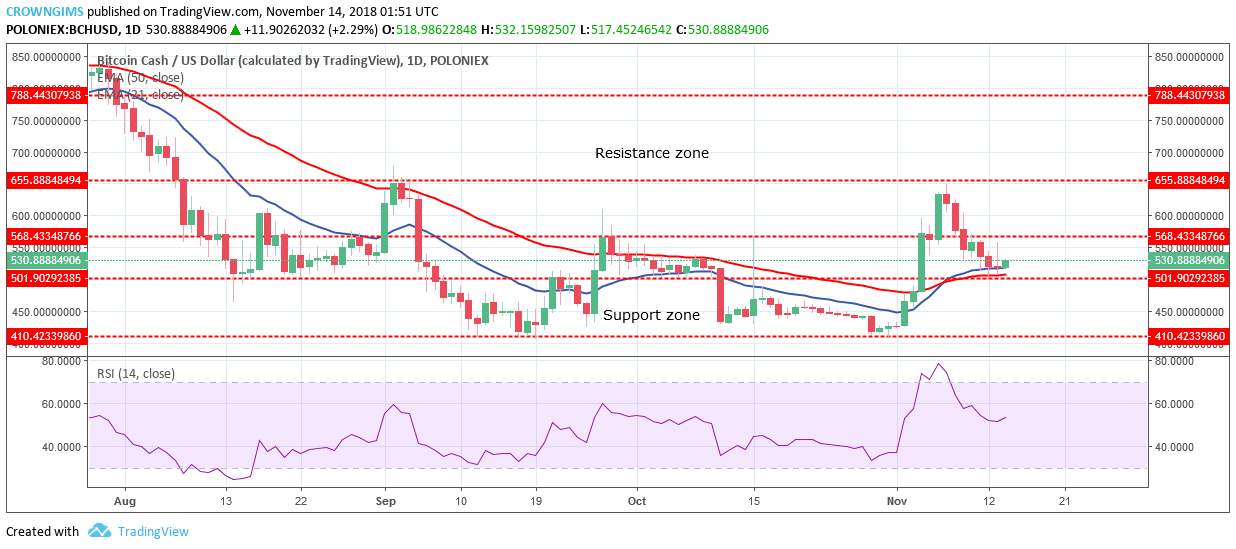
The formation of bearish pin bar candle formed on the support level of $501 (directly rest on the dynamic support and resistance of 21-day EMA and 50-day EMA) is an evidence to the bears’ strong pressure. Should the bears maintain or increase their pressure, the support zone of $501 will be broken and expose the support zone of $410 for BCH price to find its low. In case the support zone of $501 holds the price will bounce up and the bulls may take over the market for the BCH price to rally to the north and may find its high at the resistance zone of $655.

BCH/USD is directly on the 21-day EMA and 50-day EMA. Meanwhile, RSI period 14 is at the 50 levels and its signal line about turning to the north indicates a buy signal, which may be a pullback.

BCH/USD Price Medium-term Trend: Bearish

Bitcoin Cash is bearish on the 4-Hour chart, it resumed the bearish trend. The bearish engulfing candle formed at the resistance zone of $655 indicates the taken over of the market by the bears, this led to the decrease in BCH price to the broken down of the former support zone of $568 to the support zone of $501. The crossing of 21-day over 50-day EMA downside confirm the bears’ pressure.

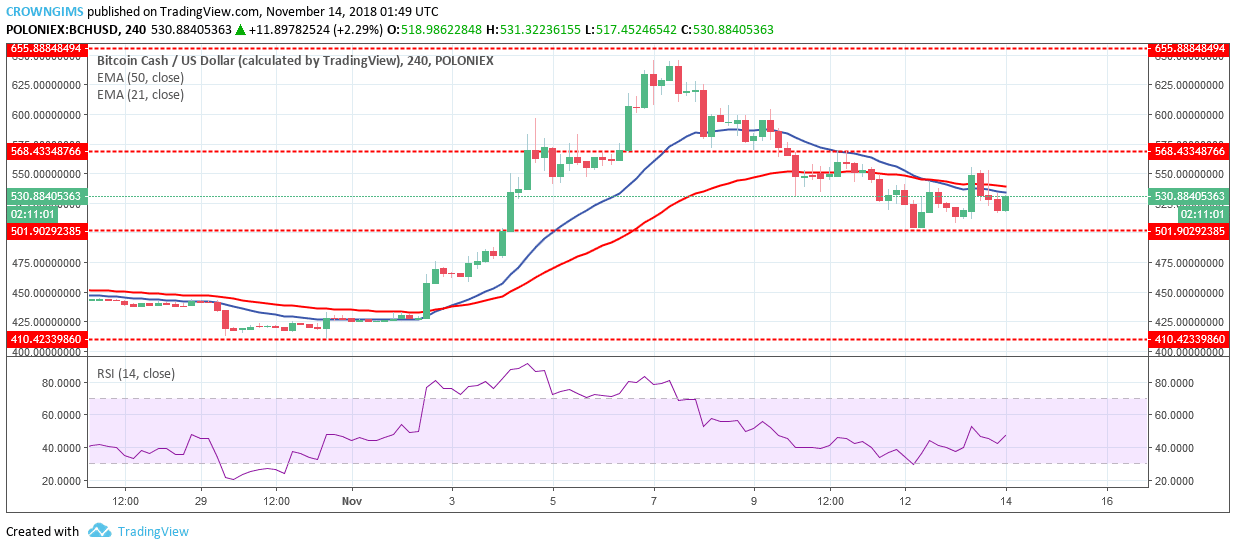
BCH price is below the 21-day EMA and 50-day EMA which is an indication of a bearish trend. The RSI period 14 is above 40 levels and its signal line points toward north connote buy signal which may be a pullback.

Share:

Related Articles

Bitcoin Cash Price Prediction: BCH Crosses $500 to Hit $10B Valuation First Time in 2025

By June 27th, 2025

Bitcoin Cash bucked the market downtrend with a 2% rally to $500, becoming the week’s top performer among top 20 altcoins. However, technical analysis reveals warning signs of potential trend reversal.

Bitcoin Cash Price Prediction as BCH Continues Outpacing BTC – Can It Overtake Bitcoin?

By June 26th, 2025

Bitcoin Cash (BCH) is making serious moves, soaring nearly 4% in the last 24 hours, reaching $498 with a 16.42% spike in trading volume, closing in on  the psychologically significant $500 price tag after breaking above the resistance at $470.

Bitcoin Cash Price Prediction: BCH Falling Wedge Pattern Confirms $1,000 Breakout Target

By June 19th, 2025

Bitcoin Cash jumped 7% on Thursday, leading top 20 cryptocurrencies as geopolitical tensions fuel demand for Bitcoin alternatives. Search interest rose 28% month-to-date, signaling renewed investor appetite.

Exit mobile version