
Bitcoin Cash broke above $570 on Wednesday, driven by the largest whale accumulation in weeks. With 66,040 BCH flowing into large holder wallets, the altcoin shows bullish momentum heading into August.
Bitcoin Cash BCH $457.2 24h volatility: 0.2% Market cap: $9.15 B Vol. 24h: $196.81 M price surged past the $570 level on Wednesday, emerging as one of the few top 20 ranked altcoins posting intraday gains. This bullish breakout aligns closely with renewed whale interest, signaling potential institutional accumulation.
IntoTheBlock’s Large Holder Netflow metric tracks the net daily movement of coins into or out of wallets controlling at least 1% of the circulating supply. According to the latest data, Bitcoin Cash whales recorded a net inflow of 66,040 BCH on Tuesday. This marks the largest single-day whale accumulation since the monthly high of 103,520 BCH on July 4.

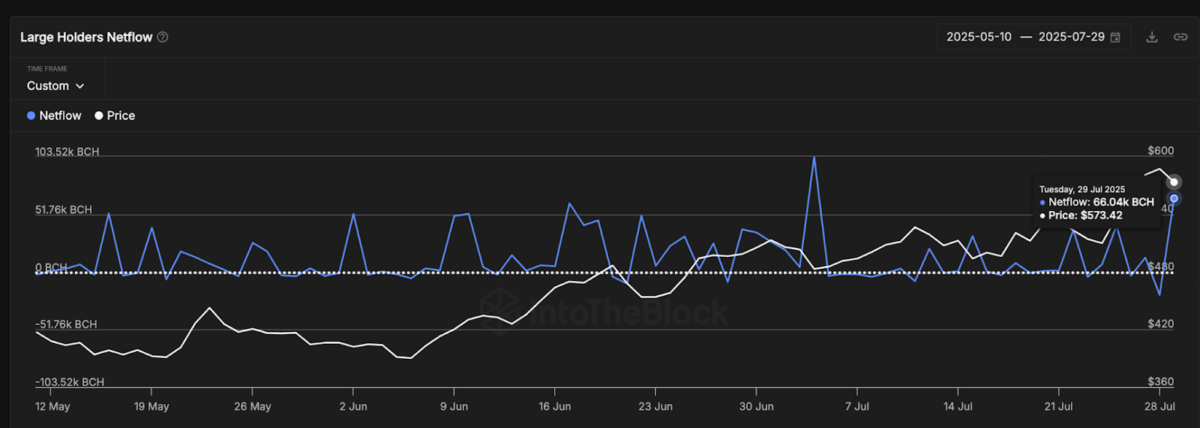
Bitcoin Cash Large Holders’ Netflow | Source: IntoTheBlock, July 30
Notably, BCH price has steadily climbed from $483 to $571, since the July 4 buying spree, validating the positive correlation between whale accumulation and BCH price action. Based on historical trends, the latest uptick in whale inflows could signal the early stages of another rally as Bitcoin Cash prepares for potential bullish momentum in August.
However, market watchers are still evaluating whether this momentum can sustain above the $570 zone, or if a rejection at the $600 resistance may trigger a prolonged correction phase.
BCH Price Prediction: $600 Resistance in Focus as Whale Demand Heats Up
From a technical analysis standpoint, Bitcoin Cash continues to trade above the 20-day moving average ($530.70), with the price currently at $571.34, reflecting a 1.28% uptick on Wednesday.
The Bollinger Bands show that BCH is now trading close to the upper band at $587.10, which has seen multiple rejections last week. A clean breakout and close above $587 could open the path toward retesting the $610 psychological resistance level, last seen in early March 2024.

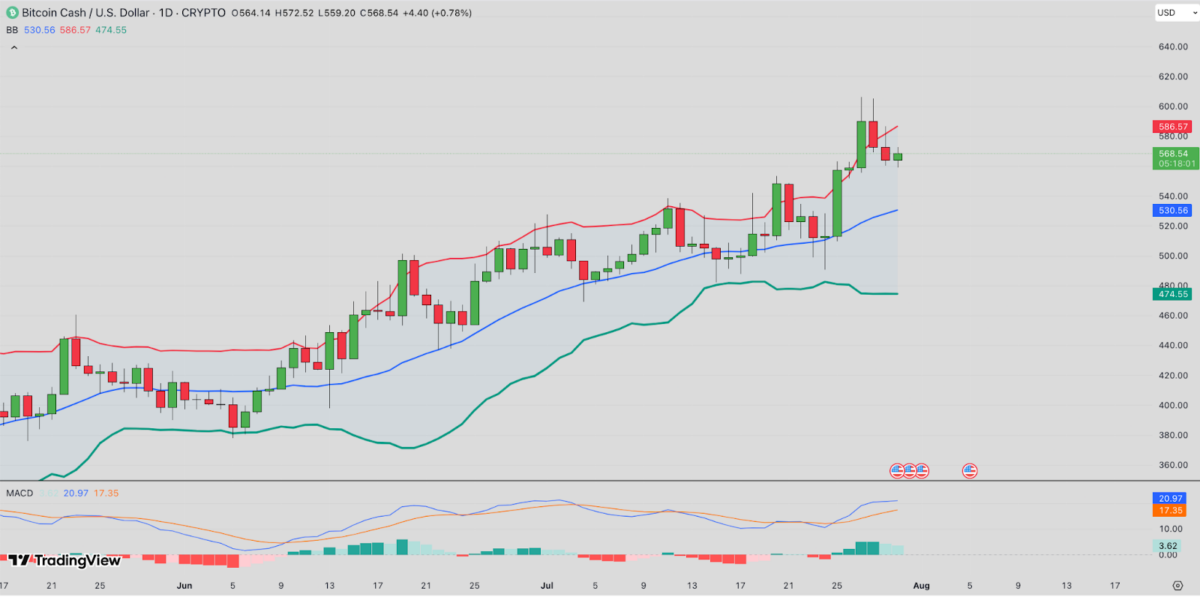
Bitcoin Cash Price Forecast | BCHUSD 24H Chart | TradingView
Meanwhile, the MACD line (21.20) remains above the signal line (17.40), confirming bullish momentum. The histogram bars are still green, though slightly declining, hinting that buying pressure could face exhaustion if $587 proves too strong to overcome this week.
If BCH holds above the $560 support and reclaims the $580-$587 resistance band, bulls may target $615 in early August. Conversely, a dip below the 20-day MA at $530 would invalidate this breakout and potentially expose the BCH price to a correction toward the $510 zone.
next