
Should the Bulls maintain their momentum, it will lead to heavy buy-off that will send Bitcoin price to the resistance level of $4,254 but lose in the Bull’s momentum may lead to consolidation around $4,050 price level.
Key Highlights:
- The $4,050 price level is already broken up and exposes $4,254 resistance level;
- the bulls are in control of the Bitcoin market;
- the coin may find its resistance at $4,254 price level.
BTC/USD Medium-term Trend: Bullish
Resistance levels: $4,254, $4,692, $4,960
Support levels: $4,050, $3,903, $3,774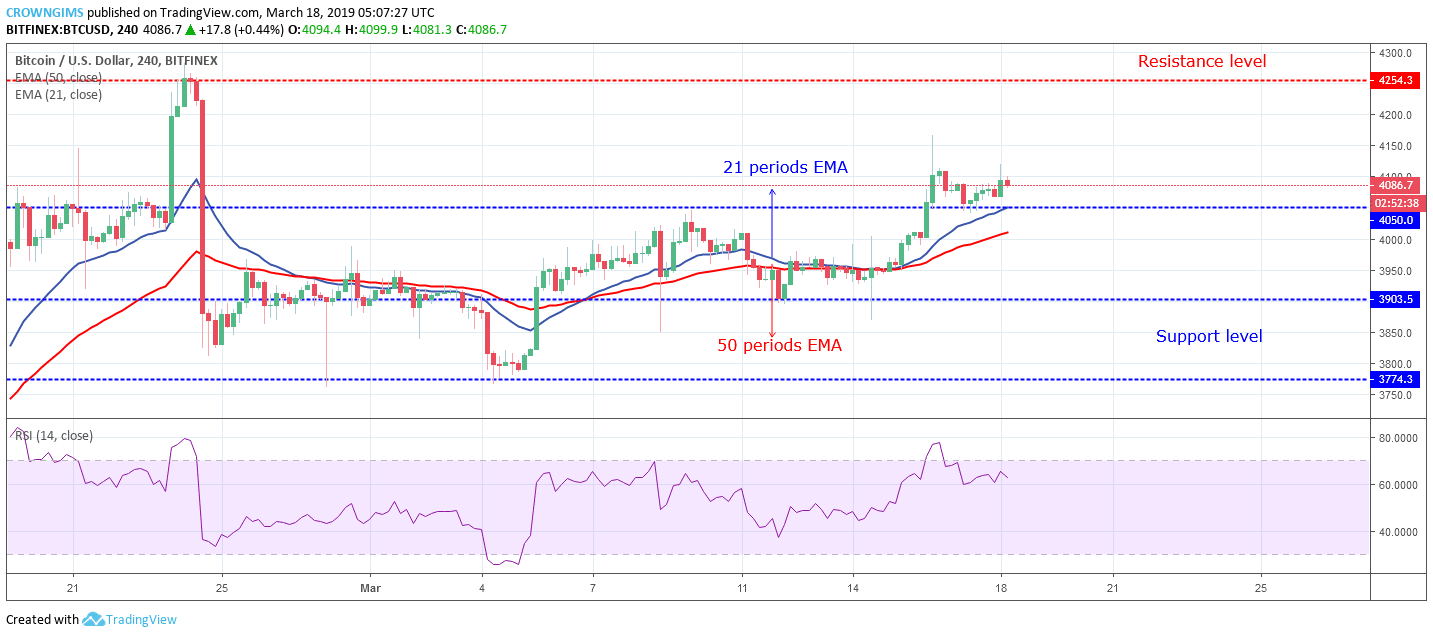

Bitcoin price has carried out retest, the resistance level of $4,254 is currently exposed to the crypto. The BTC price opened today’s market with bullish Japanese candle which connotes that the bullish momentum is increasing.
Should the Bulls maintain their momentum, it will lead to heavy buy-off that will send the BTC price to the resistance level of $4,254 but lose in the Bull’s momentum may lead to consolidation around $4,050 price level. The 21 periods EMA has crossed over the 50 periods EMA to the upside and the two are well separated which connotes increase in bullish trend.
Bitcoin price is trading above the two EMAs which indicate that the Bulls are in control of the BTC market. The Relative Strength period 14 is above 60 levels and its signal lines pointing to the south indicate sell signal which may be a pullback.
BTC/USD Short-term Trend: Bullish
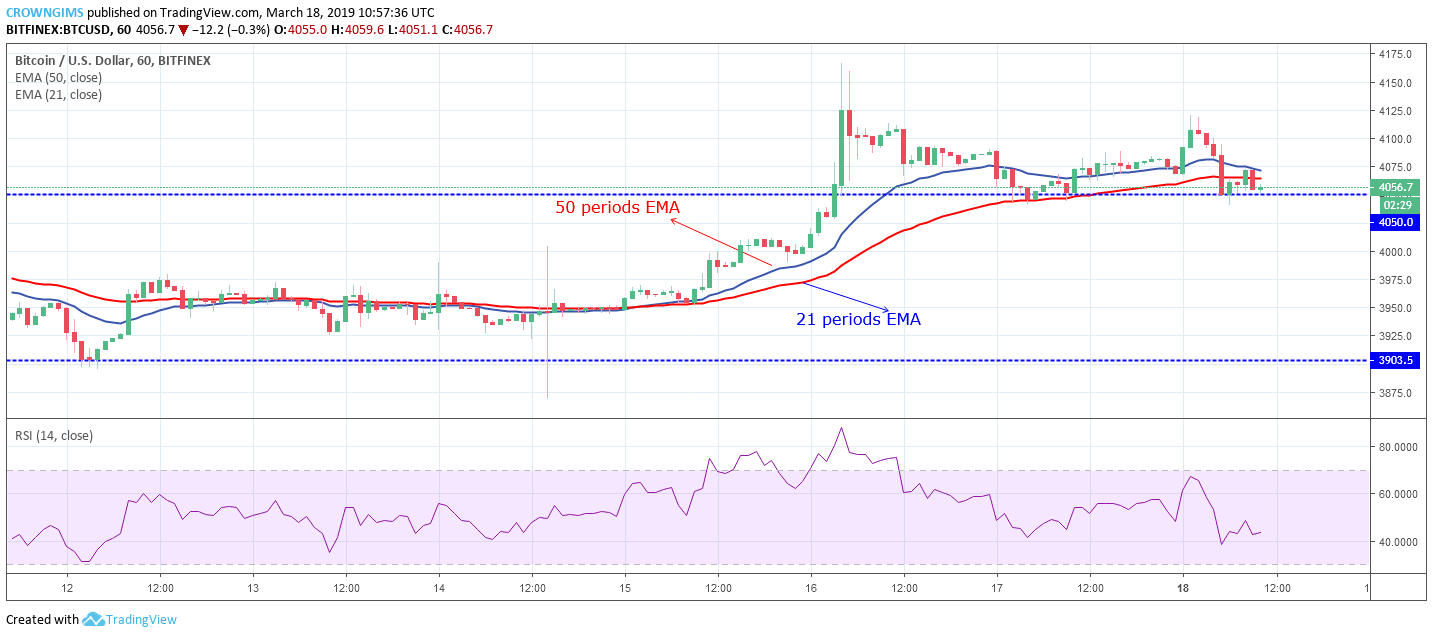
The BTC price is currently trading on the 21 periods and 50 period EMAs in which the two EMAs are gradually coming together to each other which indicate that consolidation is ongoing currently which may be for a short time. The Relative Strength Index period 14 is above 40 levels with signal lines pointing up which indicates buy signal.
next