
Increase in the Bears’ pressure will push down Bitcoin price which may break down the support level of $3,903 and expose BTC to the support level of $3,774. In case the support level of $3,903 holds, BTC price will range towards $4,047 – $4,254 price level.
Key Highlights:
- The breakdown of the $3,903 Bitcoin price level will expose $3,774 support level;
- the Bears are gradually taking over the BTC market;
- the coin may range towards 4,047 price level.
BTC/USD Long-term Trend: Bullish
Resistance levels: $4,047, $4,254, $4,692
Support levels: $3,903, $3,774, $3,637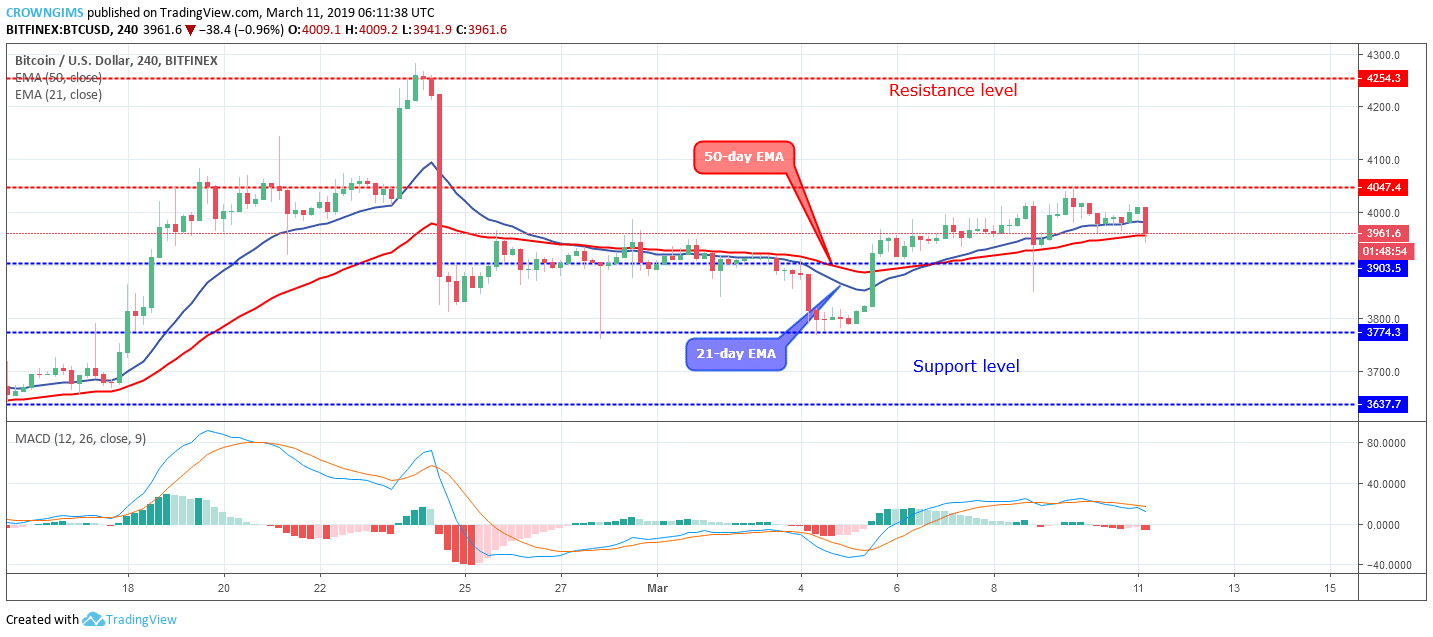

The Bearish engulfing candle formed on the March 8 penetrated the $3,903 support level downward but rejected by the bulls and returned Bitcoin price above the dynamic resistance and towards the resistance level of $4,047.
The 21 periods EMA has crossed the 50 period EMA upward as evidence of a bullish trend. The two EMAs are gradually separating from each other while the BTC price is found in between the two EMAs. The Moving Average Convergence Divergence period 12 with its histogram is faintly below the zero levels and the signal lines slightly bending down indicate sell signal.
Increase in the Bears’ pressure will push down the BTC price which may break down the support level of $3,903 and expose the coin to the support level of $3,774. In case the support level of $3,903 holds, Bitcoin price will range towards $4,047 – $4,254 price level.
BTC/USD Medium-term Trend: Bullish
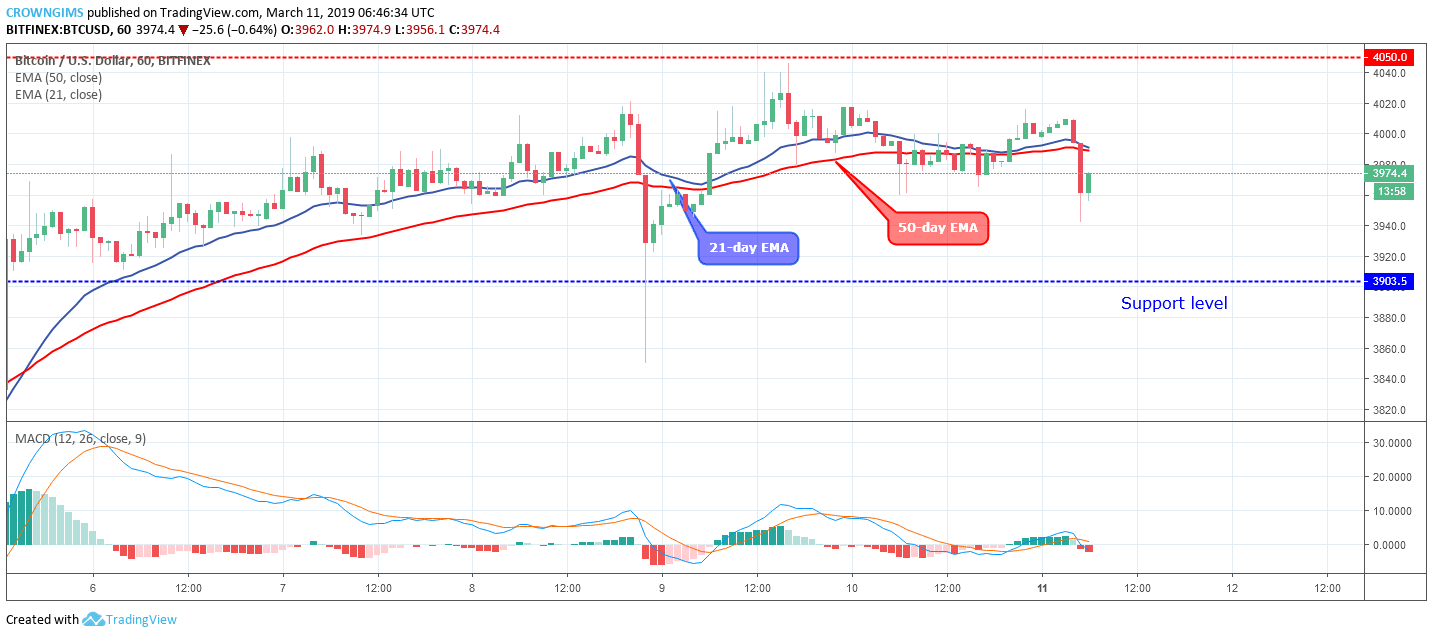
Today the Bears are gradually prevailing as the strong bearish candles are emerging and the BTC price has moved below the 21 periods and 50 period EMAs which connotes the increase in the bearish momentum. Meanwhile, the MACD with its histogram is below zero levels and the signal lines pointing down which indicate sell signal.
next