Bitcoin Price Analysis: BTC/USD is Preparing for a Big Move

On Mar 13, 2019 at 11:27 am UTC by · 2 mins read

The radical bull force will make Bitcoin rally towards $4,050 resistance level which may expose the $4,254 level. In case the bears defend the $4,050 level and the momentum is strong to penetrate the support level of $3,903 BTC will find its low at $3,774.

Key Highlights:

  • The breakup of the $4,050 Bitcoin price level will expose $4,254 resistance level;
  • consolidation is ongoing in the BTC market;
  • the coin may find its low at $3,774 price level.

BTC/USD Medium-term Trend: Ranging

Resistance levels: $4,050, $4,254, $4,692
Support levels: $3,903, $3,774, $3,637BTC/USD is moving sideways on the Medium-term outlook. The Bullish momentum that propelled Bitcoin price from the low of $3,774 could not break up the resistance level of $4,050 because of the Bear’s opposing pressure. A bearish “Harami candle” pattern formed on March 9 pushed the coin to find its support at the support level of $3,903 after broke down the two dynamic support levels and consolidation commenced.

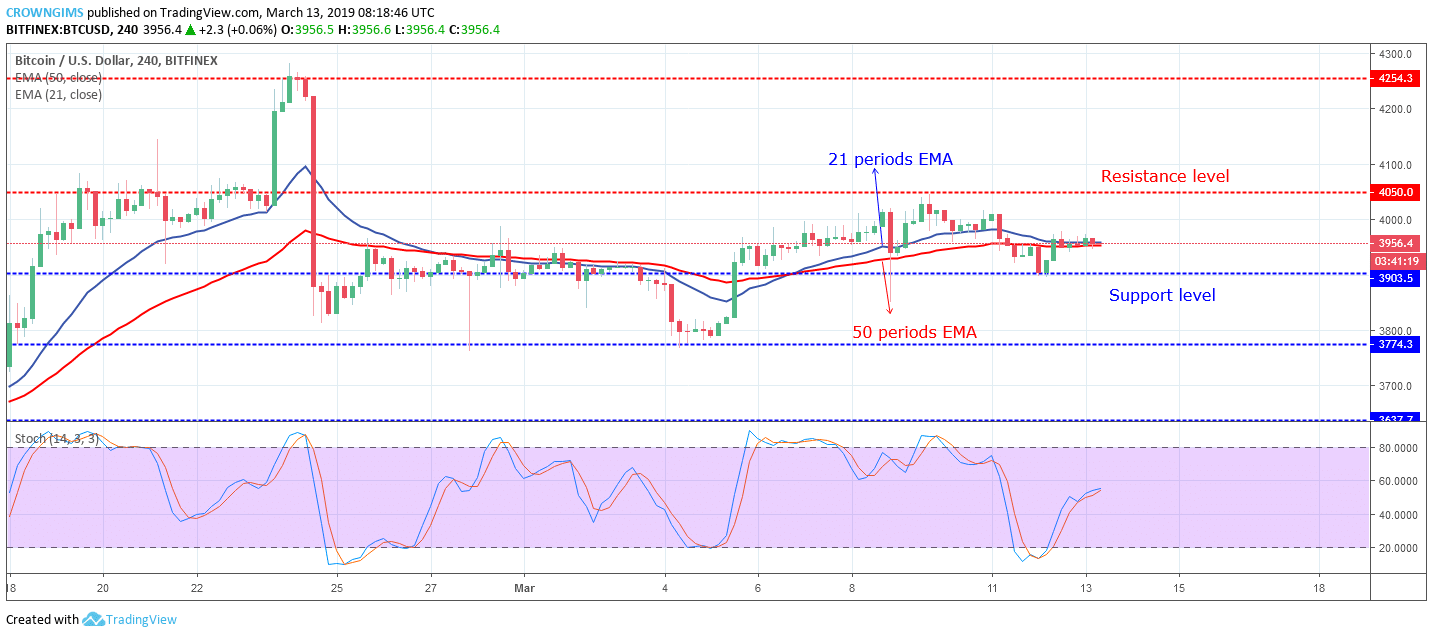
The 21 periods EMA has twisted to the 50 periods EMA and the BTC price is trading on the two EMAs which indicate that consolidation is ongoing in the BTC market. Nevertheless, the Stochastic Oscillator period 14 is above 40 levels and its signal lines pointing to the north indicate buy signal.

The radical force of the bulls will make the coin to rally towards the resistance level of $4,050 which may break the level and expose the $4,254 price level. In case the bears defend the $4,050 price level and the momentum is strong to penetrate the support level of $3,903 BTC will find its low at $3,774.

BTC/USD Short-term Trend: Ranging

The BTCUSD is ranging on the short-term outlook. The cryptocurrency found its low at $3,903 on March 12. The Bulls rejected further declination of Bitcoin price on the 1-Hour chart. “Morning star” candle pattern formed which is a bullish reversal candle pattern; this returned the BTC price toward the north and placed the coin above the two dynamic resistances where it is consolidating currently.

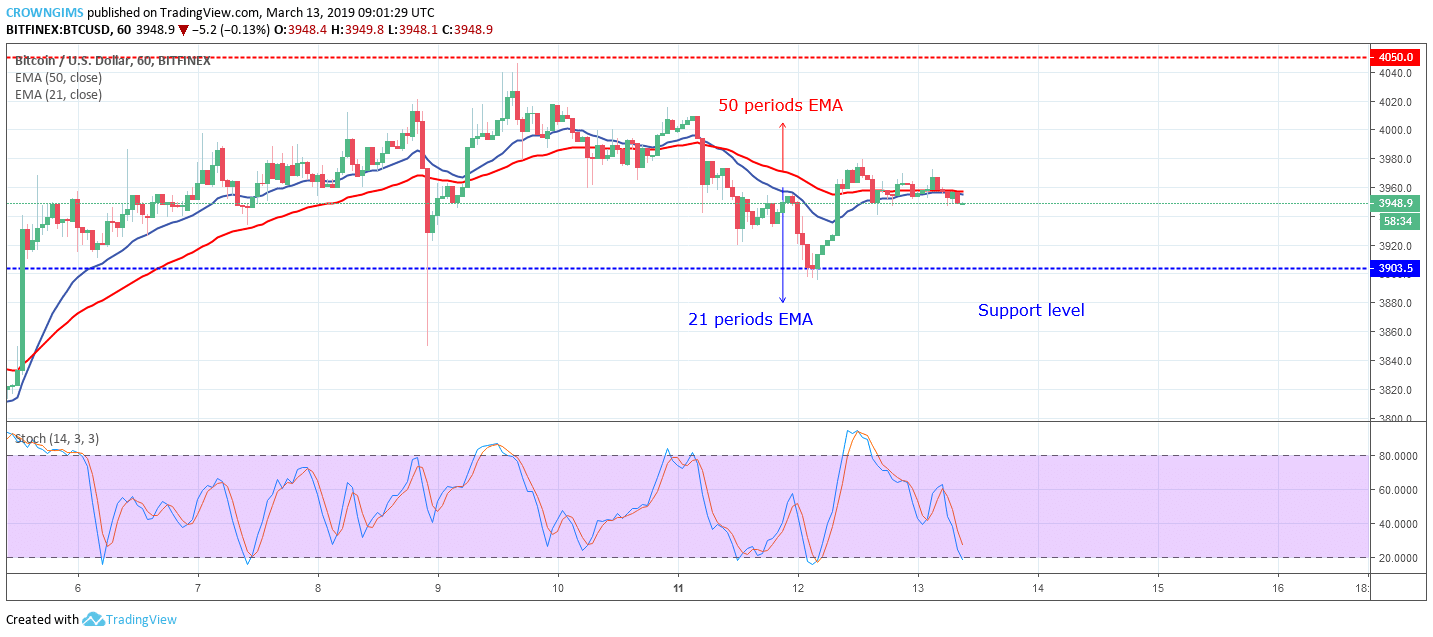
Bitcoin price is currently consolidating on the 21 periods and 50 period EMAs in which the two EMAs are interlocked to each other which connote that ranging movement may continue for a while. However, the Stochastic Oscillator period 14 is below 40 levels with signal lines pointing down which indicates sell signal.

Share:

Related Articles

As Whales Sell Off Cryptocurrencies, Causing Volatility, BTC Miner Cloud Mining Becomes the Preferred Choice for Investment Returns

By September 9th, 2025

BTC Miner is one of the leading cloud mining platforms, providing multi-currency computing power services to global investors, including Bitcoin (BTC), Ethereum (ETH), and Ripple (XRP).

Ethereum Just Made Unexpected Move Against Bitcoin, ETH Price Breakout Incoming?

By September 8th, 2025

ETH/BTC pair shows golden cross formation with 20-week EMA crossing above 50-week EMA, mirroring the 2020 pattern that preceded Ethereum’s massive outperformance against Bitcoin.

Institutional Demand for Bitcoin Fades – But Bitcoin Hyper (HYPER) Smashes $14.4M in Presale

By September 8th, 2025

Institutional Bitcoin (BTC) demand has weakened through August as firms grow more cautious with their allocations.

Exit mobile version