Bitcoin Price Analysis: BTC/USD Price Broke Out at $11,300 Level, Heading Towards $12,900

Updated on Jun 26, 2019 at 8:21 am UTC by · 2 mins read

After the pullback, the Bulls may push up Bitcoin price to penetrate the $12,900 level and target $13,400 provided the resistance level of $12,900 does not hold. In case the just mentioned level holds, the price may begin consolidation.

Key Highlights:

  • Bitcoin price broke out at $11,300 heading towards $12,900;
  • BTC may pull back at $12,900 level;
  • the Bulls dominated the Bitcoin market.

BTC/USD Medium-term Trend: Ranging

Resistance levels: $12,900, $13,400, $14,000
Support levels: $12,200, $11,600, $11,300Bitcoin price is under a strong bullish trend on the medium-term outlook. The Bulls are fully in control of the Bitcoin market. The momentum of the Bulls is propelling the price higher to the new level every day as it was predicted by the cryptocurrency analyst that BTC price may reach $15,000 before the end of June.

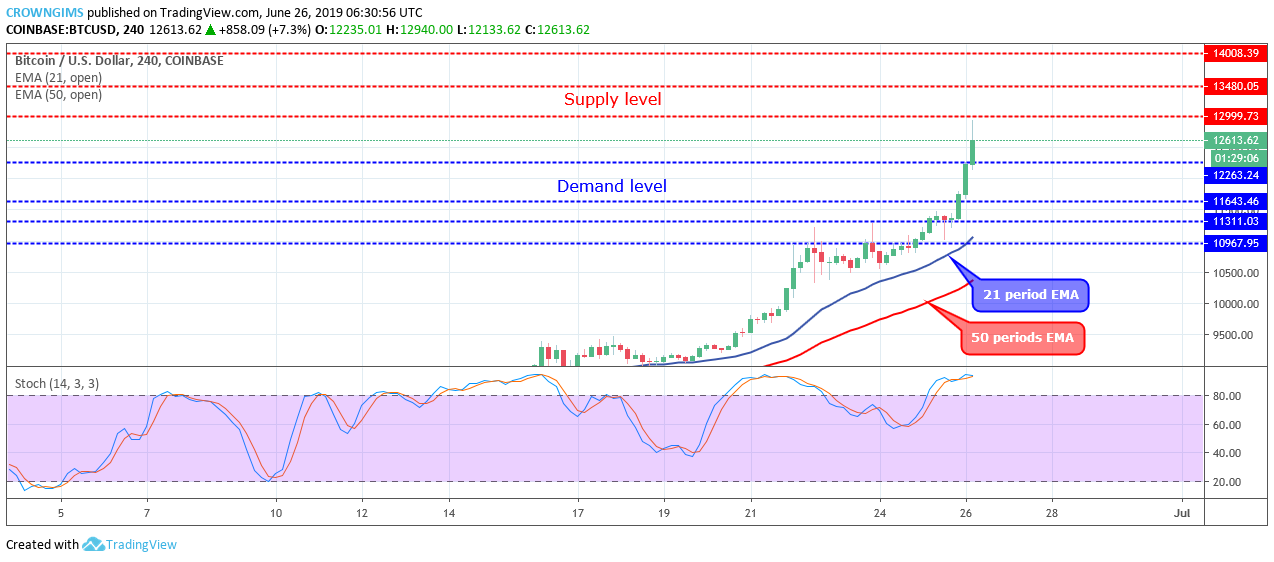
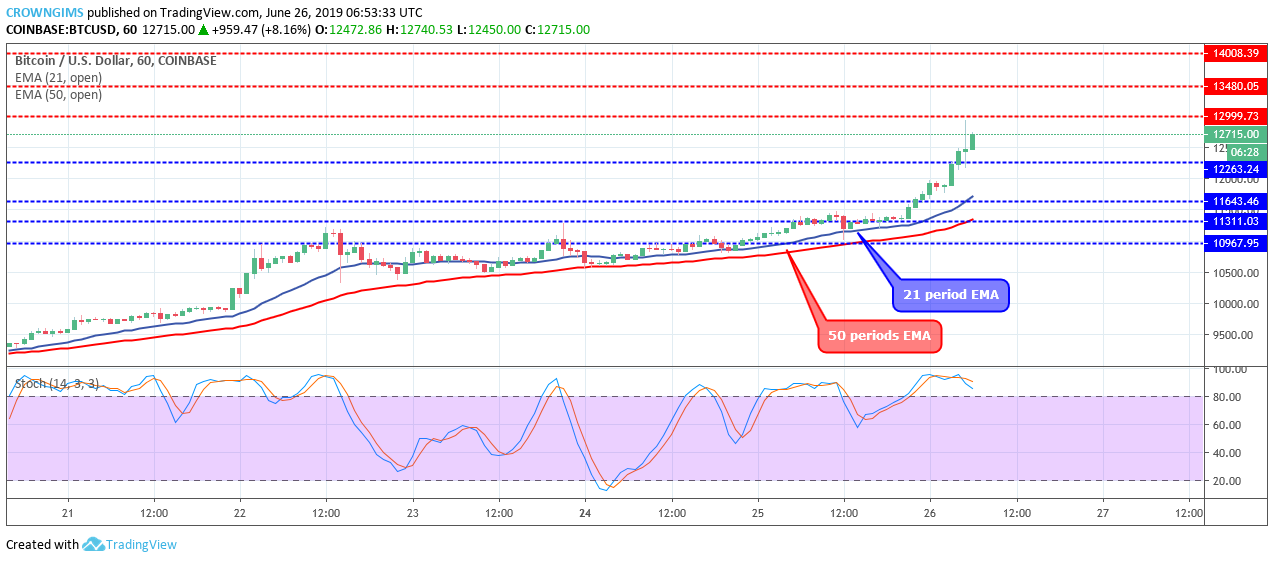
Several barriers have been broken by the coin such as $10,000, $11,300, $12,200 levels. Today, on the 4- hour chart, the Bitcoin price touched the resistance level of $12,700 level and pulled back.

The distance between the Bitcoin price and the two EMAs is increasing which is an indication of strong bullish momentum. The Bitcoin is trading above the 21 periods EMA and 50 periods EMA; this indicates a strong bullish trend. Nevertheless, the Stochastic Oscillator period 14 is above $75 and the signal lines bending down to indicate sell signal.

After the pullback, the Bulls may push up the coin to penetrate the $12,900 level and target $13,400 provided the resistance level of $12,900 does not hold. In case the just mentioned level holds, the price may begin consolidation.

BTC/USD Short-term Trend: Bullish

BTC/USD is Bullish on the short-term outlook. The Bullish momentum is not yet exhausted but rather increased. The $11,600 and $12, 200 resistance level has been penetrated up side by the Bulls pressure and Bitcoin price is currently approaching the resistance level of $12,900. However, the Stochastic Oscillator period 14 is above 80 levels (overbought level) and the signal lines bending down to indicate sell signal which may be a price retracement.

Share:

Related Articles

Michael Saylor Hints at Strategy’s 100th Bitcoin Purchase Milestone

By February 23rd, 2026

Michael Saylor Hints at Strategy’s 100th Bitcoin Purchase

Bitcoin Hits ‘Deep Value’ as RSI Plummets to 23: Is the High-Conviction Bottom In?

By February 13th, 2026

Bitcoin RSI Hits 23: Analysts Flag ‘Deep Value’ Entry Point

Bitcoin Price Prediction: New Bitcoin Protocol Upgrade Makes BTC More Quantum-Resistant – $1 Million BTC Possible Now?

By February 12th, 2026

Bitcoin’s march toward becoming a global reserve asset has faced one persistent existential question: What happens when quantum computers become powerful enough to crack its cryptography? A new proposal, BIP-360, aims to answer this, potentially clearing the final hurdle for institutional adoption. But is $1 million a real possibility for Bitcoin? For now, the first […]

Exit mobile version