Bitcoin Price Analysis: BTC/USD Consolidates Awaiting Another Bullish Ride

On May 13, 2019 at 10:39 am UTC by · 2 mins read

In case the Bulls defend the $6,869 level, the bullish trend will continue and may break up the $7,440 level and target $7,812 level. Should the demand level of $6,869 does not hold, the Bitcoin price will target $6,332 level.

Key Highlights:

  • The Bulls are may take over Bitcoin market;
  • the breakup at $6,121 level will expose $6,332resistance level;
  • the Bitcoin price may bounce at $6,121 level.

BTC/USD Medium-term Trend: Bullish

Resistance levels: $7,440, $7,812, $8,233
Support levels: $6,869, $6,332, $5,925On the medium-term outlook, BTC/USD is bullish. The Bulls have no time for the Bears in the market of Bitcoin since May 06, when the Bulls defended the $5,946 demand level and Bitcoin price bounced. Bitcoin rallied to the north and broke up $6,332, $6,869 levels moved up towards $7,440 level. On May 12, a Tweezer top candle pattern formed; which is a bearish reversal pattern. The Bitcoin pulled back to $6,869 where it is currently consolidating.

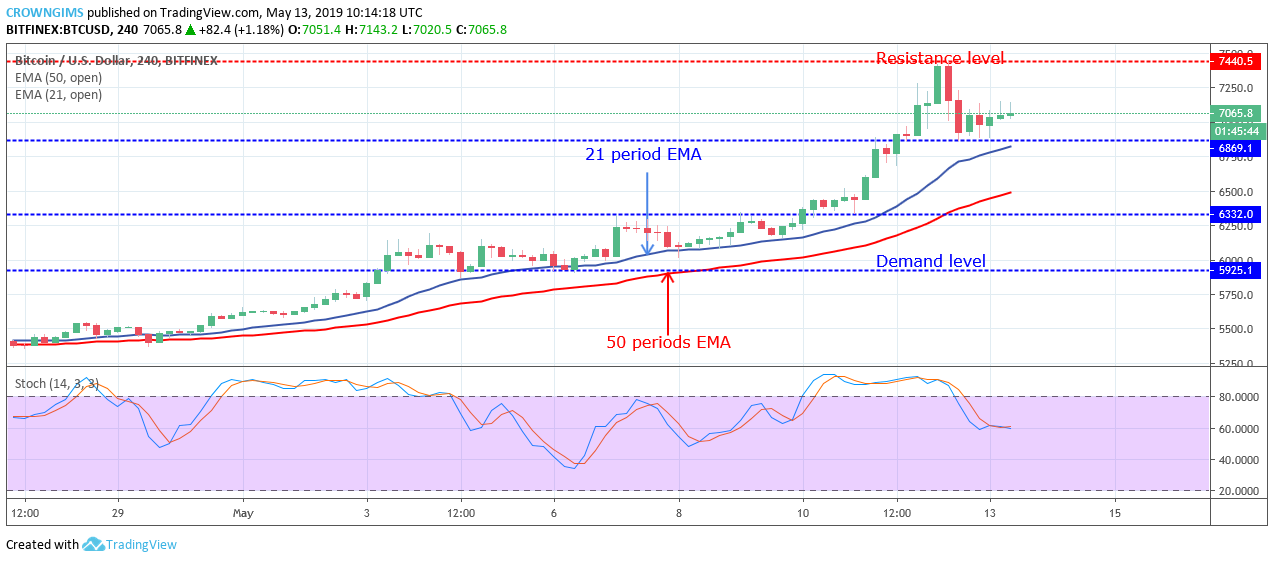
Bitcoin price is trading above the 21 periods EMA and 50 periods EMA. The distance between BTC price and the two EMAs is increasing to indicate that the Bulls’ pressure is increasing. The Stochastic Oscillator period 14 is at 40 with the signal lines twisted to each other to indicate that consolidation is ongoing in the BTC market.

In case the Bulls defend the $6,869 level, the bullish trend will continue and may break up the $7,440 level and targets $7,812 level. Should the demand level of $6,869 does not hold, the coin will target $6,332 level.

BTC/USD Short-term Trend: Bullish

BTC/USD is ranging in the short-term outlook. The Crypto was ranging last week, the Bulls gained enough momentum and pushed up the coin to reach the supply level of $7,440 on May 12. The Bears reacted against the price increase by the formation of a hanging man candle pattern, which reversed the Bitcoin price to touch $6,869 demand level. Sideways movement is ongoing on the 1-hour chart in the Bitcoin market.

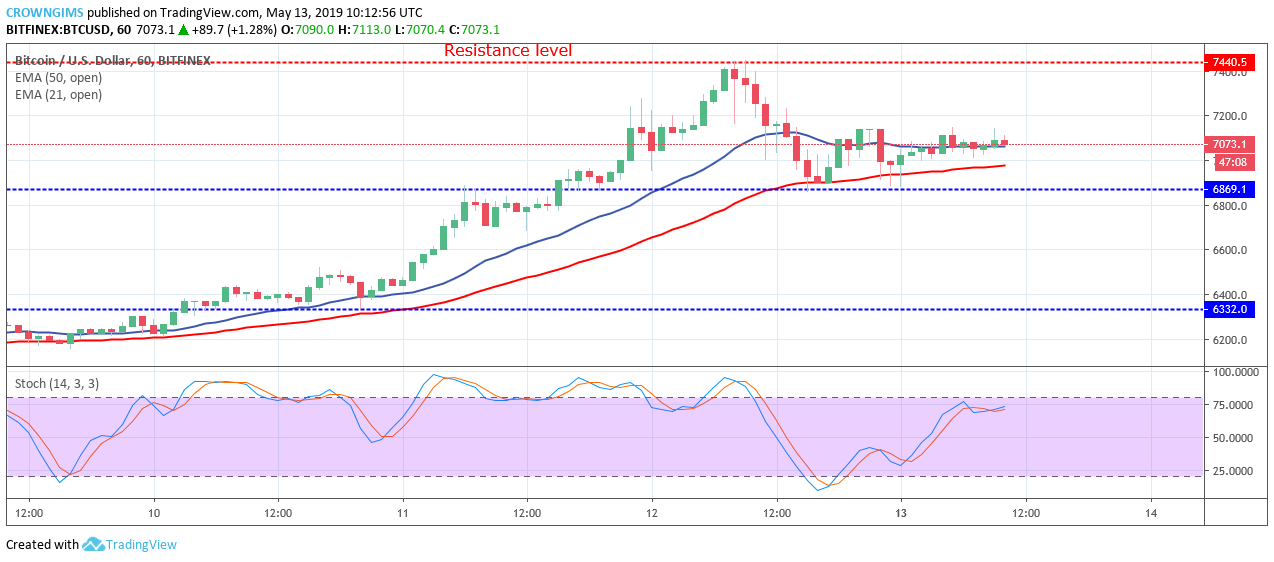
The coin is trading in between the 21 period EMA and 50 periods EMA with the two EMAs flat at the level showing no direction confirms the ongoing consolidation. However, Stochastic Oscillator period 14 is at $75 bending up to connotes buy signal.

Share:

Related Articles

Bitcoin Hits ‘Deep Value’ as RSI Plummets to 23: Is the High-Conviction Bottom In?

By February 13th, 2026

Bitcoin RSI Hits 23: Analysts Flag ‘Deep Value’ Entry Point

Bitcoin Price Prediction: New Bitcoin Protocol Upgrade Makes BTC More Quantum-Resistant – $1 Million BTC Possible Now?

By February 12th, 2026

Bitcoin’s march toward becoming a global reserve asset has faced one persistent existential question: What happens when quantum computers become powerful enough to crack its cryptography? A new proposal, BIP-360, aims to answer this, potentially clearing the final hurdle for institutional adoption. But is $1 million a real possibility for Bitcoin? For now, the first […]

Robert Kiyosaki Sells Bitcoin and Gold as Crypto Market Loses $750B

By February 6th, 2026

Since Oct. 10, 2025, Bitcoin’s price has fallen about 44%, but US spot Bitcoin ETFs have reduced their BTC holdings by only 6.6%, showing major strength.

Exit mobile version