Bitcoin Price Analysis: BTC/USD Price Reversed at $9,007, Heading Towards $8,233 Level

On May 29, 2019 at 9:42 am UTC by · 2 mins read

Bears are increasing their momentum as the bearish candle is pushing Bitcoin price downward to $8,233. Without the interruption of the Bulls, BTC price may reach $8,233. In case the Bulls fail to defend the mentioned level the price may target $7,812.

Key Highlights:

  • Bitcoin price broke down the $8,608 level;
  • the Bears are taking over the BTC market gradually;
  • the price may reach $8,233 level.

BTC/USD Medium-term Trend: Bearish

Resistance levels: $8,608 $9,007, $9,480
Support levels: $8,233, $7,812, $7,476On the medium-term outlook, BTC/USD is Bearish. There was a bullish breakout at $8,608 level on May 26. Shortly after the breakout, the coin started consolidating within the range of $8,608 and $9,007 price level. The Bitcoin market opened this morning with a bearish candle, followed the scenario is another bearish candle that penetrated the $8,608 price level. The demand level of $8,233 is currently exposed to the coin. The bearish trend may continue on the 4-hour chart.

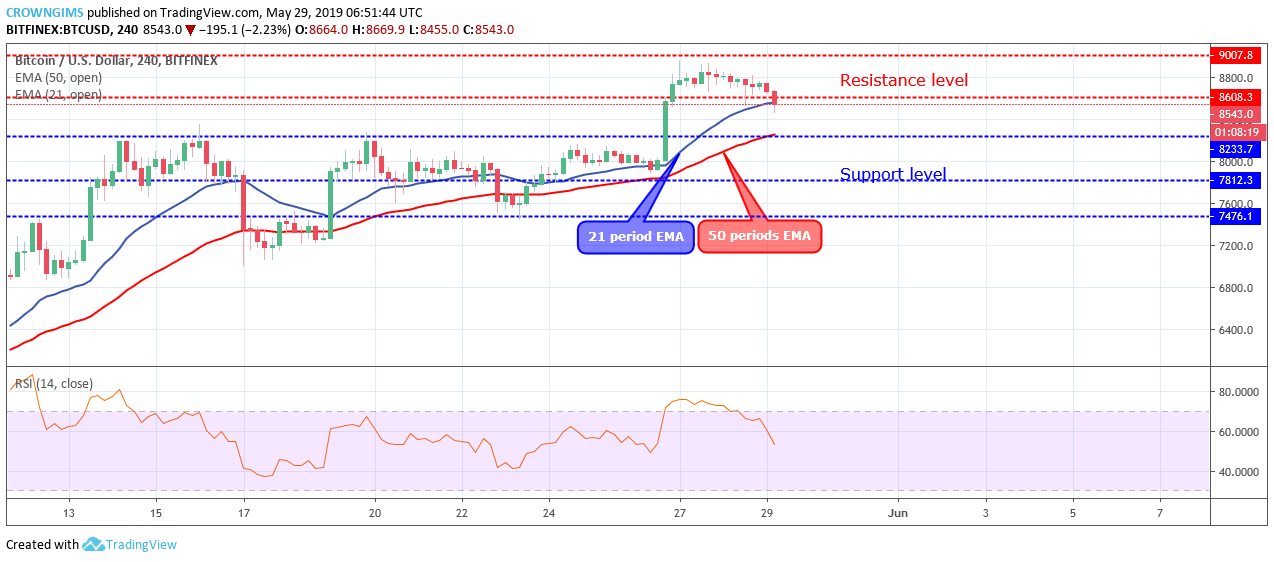
Bitcoin price is making an attempt to break down the 21-period EMA while the 50 periods EMA is at a distance to the 21 periods EMA. The Relative Strength Index period 14 is at 50 levels with the signal line pointing down to indicates sell signal.

The Bears are increasing their momentum as the bearish candle that penetrated the $8,608 level is pushing Bitcoin price downward towards $8,233 level. Without the interruption of the Bulls, the price may reach the $8,233 level. In case the Bulls do not defend just mentioned level BTC may target $7,812 level.

BTC/USD Short-term Trend: Bearish

On the short-term outlook, BTC/USD is Bearish. The Bears finally prevailed over the Bulls; thus, the price broke out at the $8,608 level with a strong bearish candle. Bitcoin price is at the moment facing $8,233 level. The pullback is inevitable after the price break up or down a particular level.

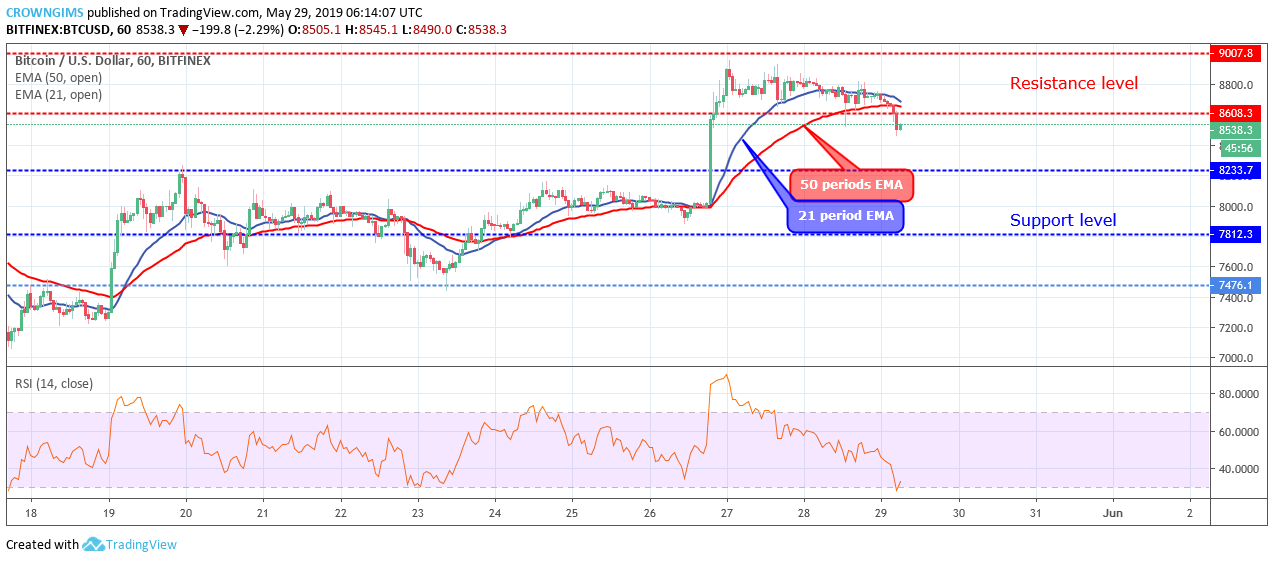
The coin has crossed the two EMAs downside on 1-hour chart and the price is trading below the 21 periods EMA and 50 periods EMA. The Relative Strength Index period 14 is at 30 levels and the signal line pointing up to indicate buy signal but this may be a pullback.

Share:

Related Articles

The Bitcoin Rocket: Still Fueling up After 9 Weeks of Inflows?

By June 16th, 2025

After nine straight weeks of inflows and technical resilience, Bitcoin hovers near all-time highs as whales, retail, and institutions alike double down on conviction.

This Indicator Suggests Further Upside for Bitcoin: New BTC ATH?

By June 16th, 2025

Bitcoin and the broader cryptocurrency market are anticipating a potential upside due to declining exchange flows.

Bitcoin Golden Cross Shows A BTC Price Revival Coming Soon

By June 14th, 2025

Bitcoin has recovered above $105,000, after dipping under $013,000 earlier this week, with this rebound supported by the formation of a Golden Cross.

Exit mobile version