Bitcoin Price Analysis: BTC/USD Price May Rally Towards $8,233 Level

On Jun 10, 2019 at 11:13 am UTC by · 2 mins read

If the Bears gain enough pressure to penetrate the demand level of $7,476 and the bearish candle closes below it, Bitcoin price may reach $7,085. Alternatively, if the Bulls push the price above $8,233, BTC may eventually touch a previous high of $8,608.

Key Highlights:

  • Bitcoin price is ranging at $7,812 level;
  • the coin may rally towards $8,233 level
  • the Bears may push the price to reach $7,085.

BTC/USD Medium-term Trend: Ranging

Resistance levels: $7,812, $8,233, $8,608
Support levels: $7,476, $7,085, $6,612Bitcoin price is moving sideways on the medium-term outlook. The sideways movement continues in the Bitcoin market due to the weakness in the momentum of the Bulls and the weakness in the Bears’ pressure. The ranging movement started on June 04 after the Bears pushed the coin to the low of $7,476 level.

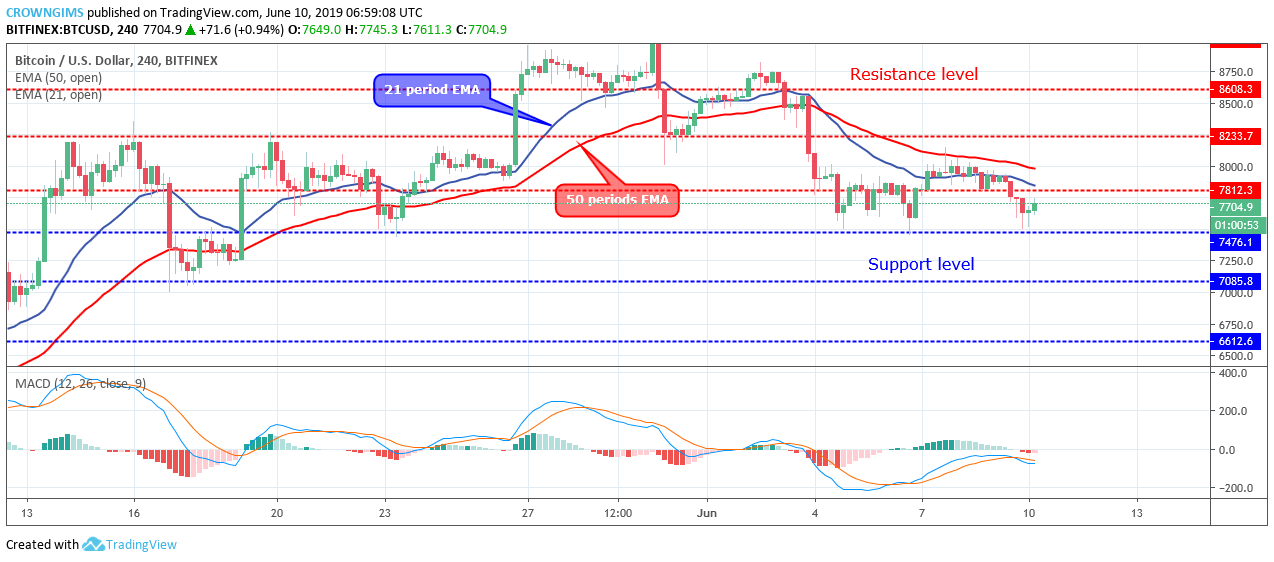
On June 06, the Bulls pushed the price to break up the $7,812 level and the price moved towards $8,233, unable to reach the mark before it was resisted by the dynamic resistance levels (21 and 50 periods EMAs). Bitcoin needs a radical momentum from the Bears or the Bulls so as to make the Bitcoin rally to the south or to the north respectively.

Bitcoin price is trading below the 21-period EMA and the 50 periods at a slow rate. The Moving Average Convergence Divergence period 12 is faintly below zero levels and the signal lines bending down to indicate sell signal.

Should the Bears gain enough pressure to penetrate the demand level of $7,476 level and the bearish candle closes below the level, then, the Bitcoin price may reach $7,085 level. On the other hand, in case the Bulls push the price above $8,233, the coin may eventually touch a previous high of $8,608.

BTC/USD Short-term Trend: Ranging

BTC/USD is ranging in the short-term outlook. Both the Bulls and the Bears’ momentum are at equilibrium for more than five days. Bitcoin price has been consolidating at $7,812 level since June 04. Yesterday, the price was able to reach a low of $7,476 level. Currently, the Bulls are pushing the coin towards 47,812 levels.

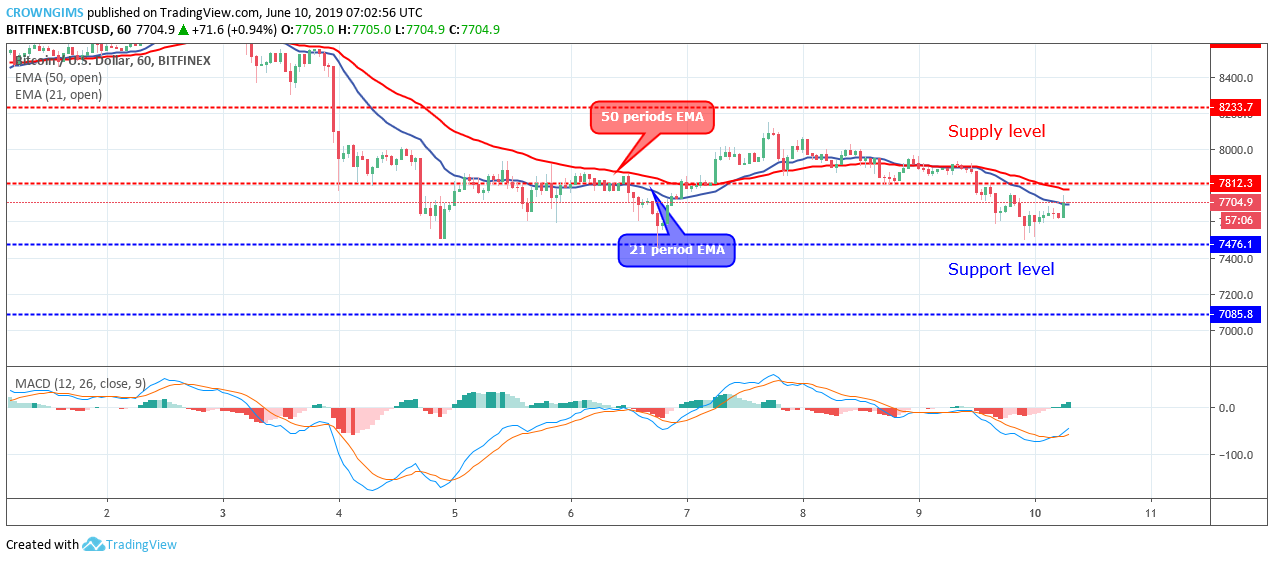
Bitcoin price is below the two EMAs. The Moving Average Convergence Divergence period 12 and its histogram are above zero level and the signal line pointing up to indicate a buy signal.

Share:

Related Articles

Bitcoin Hits ‘Deep Value’ as RSI Plummets to 23: Is the High-Conviction Bottom In?

By February 13th, 2026

Bitcoin RSI Hits 23: Analysts Flag ‘Deep Value’ Entry Point

Bitcoin Price Prediction: New Bitcoin Protocol Upgrade Makes BTC More Quantum-Resistant – $1 Million BTC Possible Now?

By February 12th, 2026

Bitcoin’s march toward becoming a global reserve asset has faced one persistent existential question: What happens when quantum computers become powerful enough to crack its cryptography? A new proposal, BIP-360, aims to answer this, potentially clearing the final hurdle for institutional adoption. But is $1 million a real possibility for Bitcoin? For now, the first […]

Robert Kiyosaki Sells Bitcoin and Gold as Crypto Market Loses $750B

By February 6th, 2026

Since Oct. 10, 2025, Bitcoin’s price has fallen about 44%, but US spot Bitcoin ETFs have reduced their BTC holdings by only 6.6%, showing major strength.

Exit mobile version