Bitcoin Price Analysis: BTC/USD Remains at $4,050 Expecting Breakout

On Mar 27, 2019 at 6:30 am UTC by · 2 mins read

In case the Bulls were able to penetrate the supply level of $4,050 upside and the bullish candle close above the level, $4,144 supply level may be its target. In case Bitcoin price holds $4,050 level, the bearish movement may continue.

Key Highlights:

  • Consolidation is ongoing in the Bitcoin market;
  • Bitcoin price will target $3,903 in case $4,050 level does not hold;
  • the coin may find its resistance at $4,144 price level.

BTC/USD Medium-term Trend: Bearish

Resistance levels: $4,050, $4,144, $4,254
Support levels: $3,903, $3,774, $3,637On the Medium-term outlook, BTC/USD is Bearish. BTCUSD consolidated for four days (March 21 – March 25). The Bears eventually gained momentum over the Bulls and there was a breakout towards the south with the formation of bearish candles that broke down the former demand level of $4,050 and Bitcoin price declined towards the demand level of $3,903.

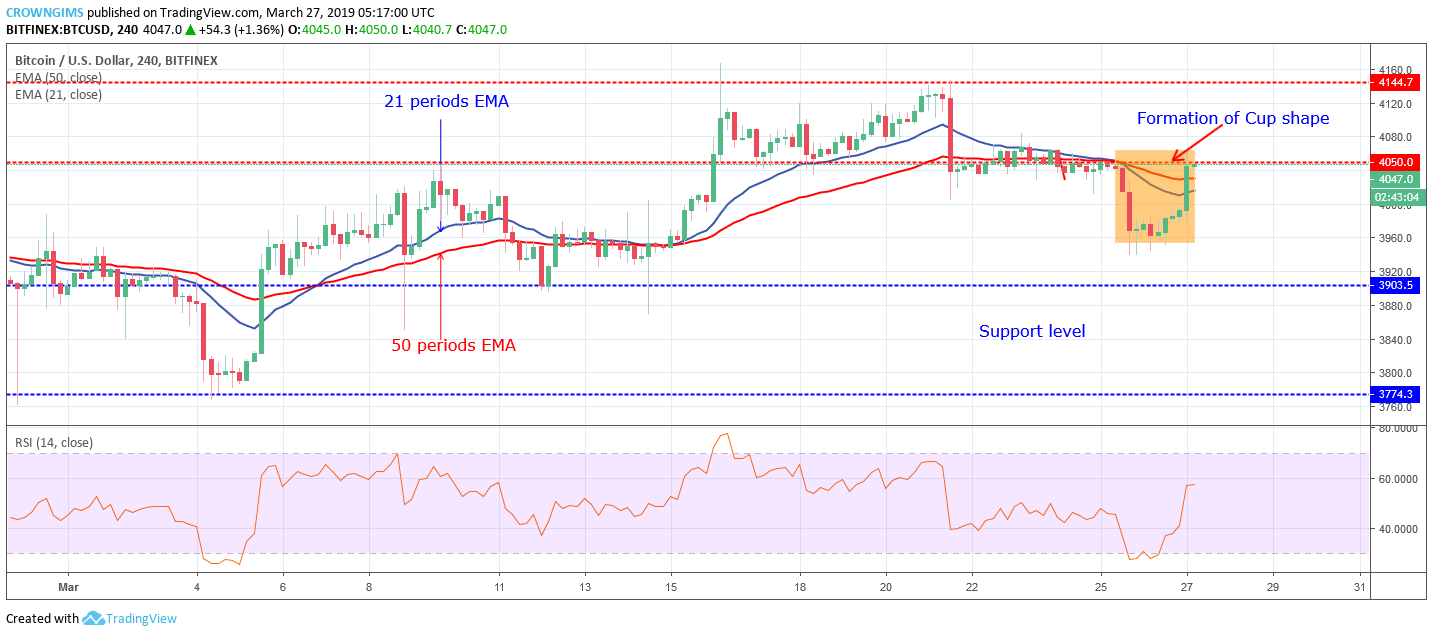
The BTC price was supported at the zone of $3,903 and the doji candle formed followed by a bullish candle pushed up the price to the supply level of $4,050 to form a cup shape pattern.

The Bulls has pushed up Bitcoin price across the 21 periods EMA and 50 periods EMA with the two EMAs bending upside to indicate bullish pressure in the BTC market.

The Relative Strength Index is at 60 levels with the signal line pointing up to indicate buy signal. In case the Bulls were able to penetrate the supply level of $4,050 upside and the bullish candle close above the level, $4,144 supply level may be its target. In case the $4,050 level holds, the bearish movement may continue.

BTC/USD Short-term Trend: Bullish

On the short-term outlook, BTC/USD is bullish. The consolidation scenario came to an end on March 25 by the Bears as the strong bearish candle broke down the $4,050 level and Bitcoin price rolled down towards $3,903 price level. The bullish engulfing candle emerged that signified the Bulls’ increased pressure and this returned the BTC price to the supply level of $4,050 to form cup shape pattern.

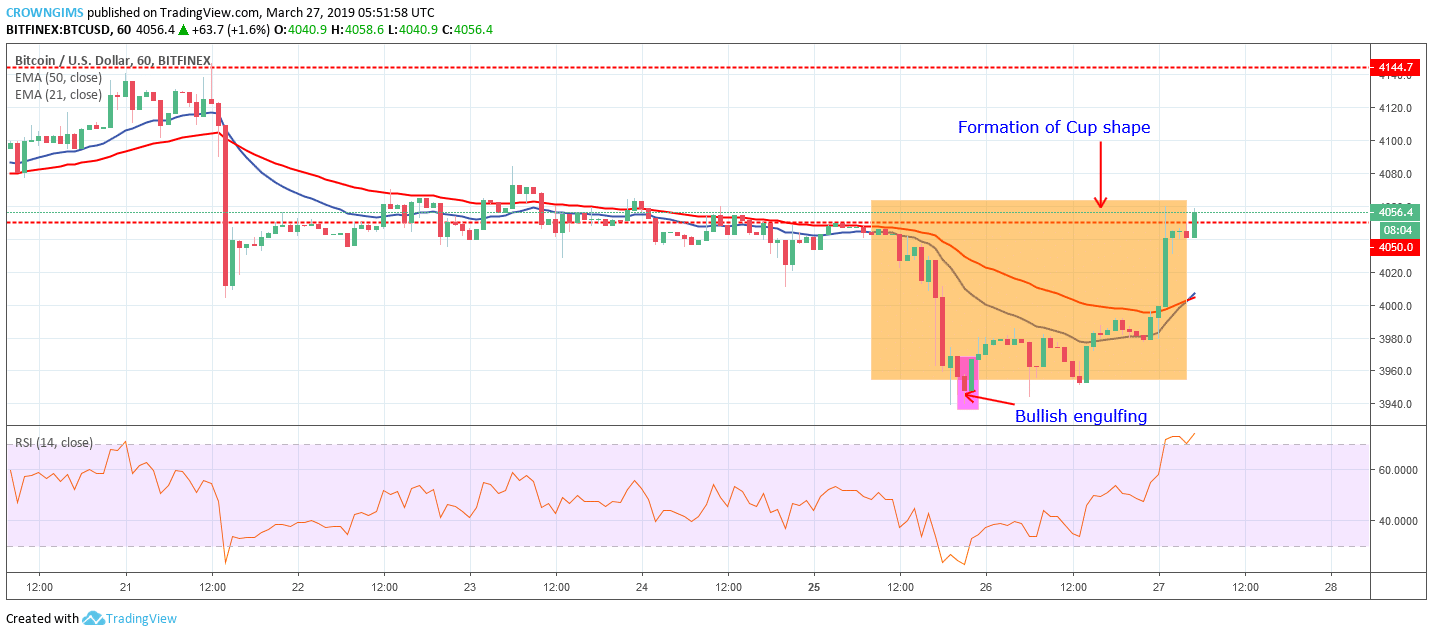
The BTC is trading above the 21 periods EMA and 50 periods EMA with the former trying to cross the later upside to confirm the bullish trend. Meanwhile, the RSI is at 70 levels with a signal line pointing up to indicate further increase in Bitcoin price.

Share:

Related Articles

Michael Saylor Hints at Strategy’s 100th Bitcoin Purchase Milestone

By February 23rd, 2026

Michael Saylor Hints at Strategy’s 100th Bitcoin Purchase

Bitcoin Hits ‘Deep Value’ as RSI Plummets to 23: Is the High-Conviction Bottom In?

By February 13th, 2026

Bitcoin RSI Hits 23: Analysts Flag ‘Deep Value’ Entry Point

Bitcoin Price Prediction: New Bitcoin Protocol Upgrade Makes BTC More Quantum-Resistant – $1 Million BTC Possible Now?

By February 12th, 2026

Bitcoin’s march toward becoming a global reserve asset has faced one persistent existential question: What happens when quantum computers become powerful enough to crack its cryptography? A new proposal, BIP-360, aims to answer this, potentially clearing the final hurdle for institutional adoption. But is $1 million a real possibility for Bitcoin? For now, the first […]

Exit mobile version