Bitcoin Price Analysis: BTC/USD Expected to Break Up $5,299 Rising Towards $5,574

Updated on Apr 28, 2022 at 11:28 am UTC by · 2 mins read

The breakup of strong resistance level of $5,299 by the Bulls with increased momentum will make Bitcoin price to rally towards $5,574 resistance level. Should the Bears defend the level the second time, BTC price may fall.

Key Highlights:

  • The Bitcoin price remains at $5,299;
  • the Bulls are still in control of the BTC market;
  • BTC/USD is expected to break up $5,299 price level.

BTC/USD Medium-term Trend: Bullish

Resistance levels: $5,299, $5,574, $5,840
Support levels: $4,988, $4,742, $4,491On the Medium-term outlook, BTC/USD is still on the bullish trend. On April 3, Bitcoin price reached a high of $5,299 but unable to break up. The Bears resisted further increase in the price of BTC and the coin was pulled back to retest the broken support level of $4,988.

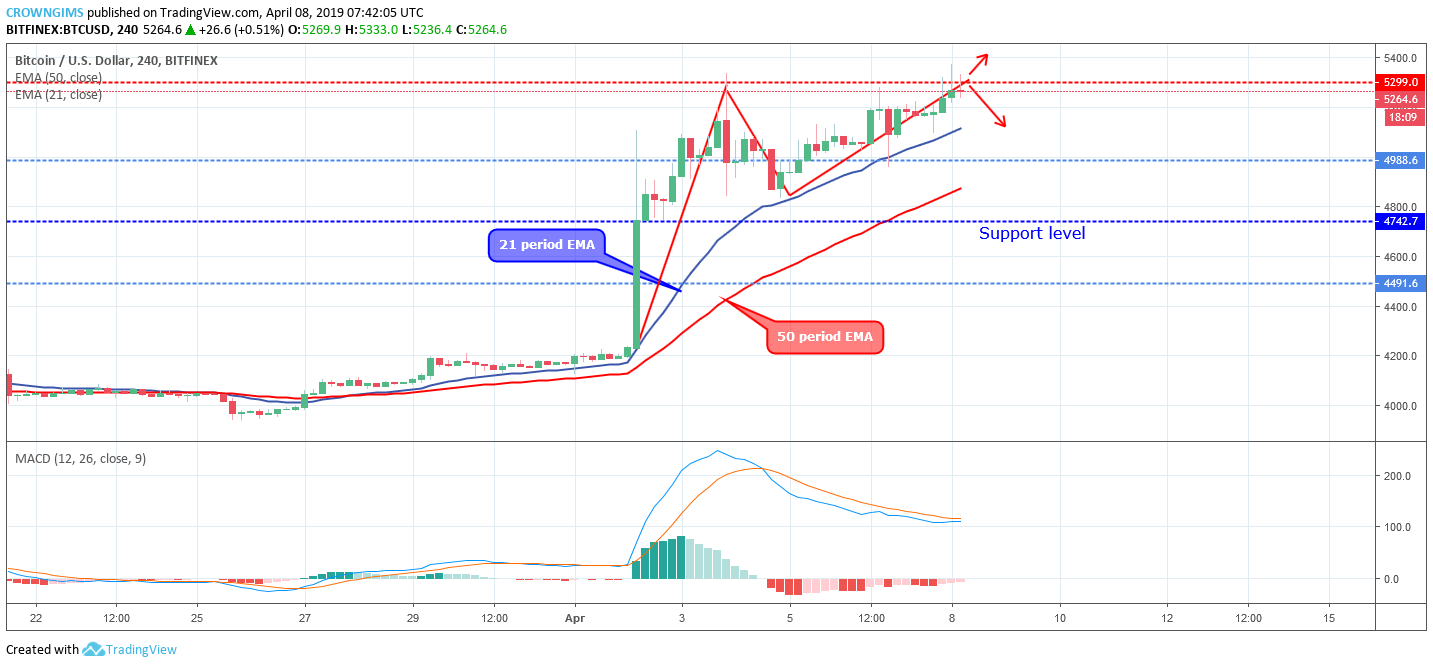
On April 4, BTC resumed its uptrend movement towards the previous high. At the moment, the coin is making an attempt to break up the $5,299 price level.

Bitcoin price is steadily trading above the 21 periods EMA and 50 periods EMA with the two EMAs fanned apart and steeply upward to indicate strong bullish momentum in the BTC market. The histogram of Moving Average Convergence Divergence period 12 is below zero levels and the signal lines bending down to indicate sell signal and also shows that the coin is facing a strong resistance level.

The breakup of strong resistance level of $5,299 by the Bulls with increased momentum will make the coin to rally towards $5,574 resistance level. Should the Bears defend the level the second time, BTC price may fall.

BTC/USD Short-term Trend: Bullish

BTC/USD is on the bullish trend on the short-term outlook. The Bears returned Bitcoin price below $4,988 price level on April 4, after it touched $5,299 price level and the Bulls lost momentum. The Bulls also prevented the price to reach the support level of $4,742 by the formation of inside bar candle pattern that propelled the BTC price to reach $5,299 price level.

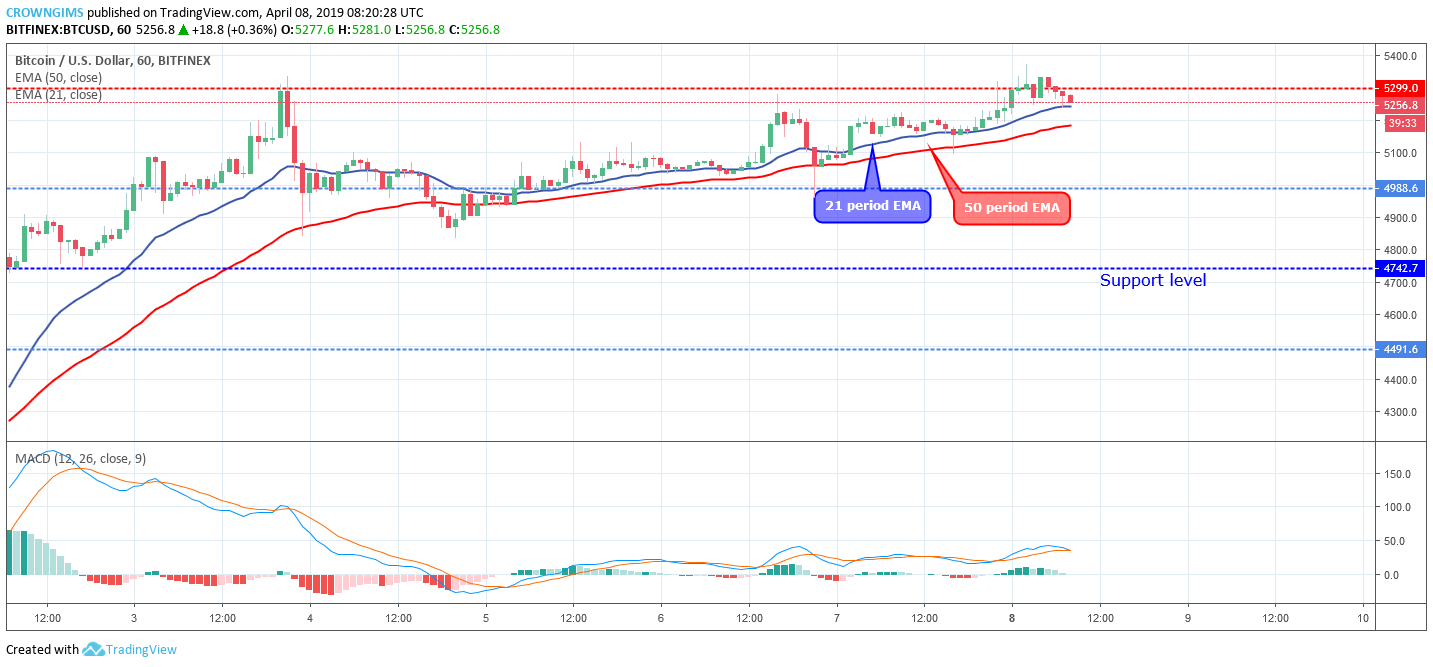
Bitcoin price remains above the 21 periods EMA and 50 periods EMA. The Moving Average Convergence Divergence periods 12 with its histogram and signal lines are above zero levels which indicates buy signal and a further increase in the price.

Share:

Related Articles

Michael Saylor Hints at Strategy’s 100th Bitcoin Purchase Milestone

By February 23rd, 2026

Michael Saylor Hints at Strategy’s 100th Bitcoin Purchase

Bitcoin Hits ‘Deep Value’ as RSI Plummets to 23: Is the High-Conviction Bottom In?

By February 13th, 2026

Bitcoin RSI Hits 23: Analysts Flag ‘Deep Value’ Entry Point

Bitcoin Price Prediction: New Bitcoin Protocol Upgrade Makes BTC More Quantum-Resistant – $1 Million BTC Possible Now?

By February 12th, 2026

Bitcoin’s march toward becoming a global reserve asset has faced one persistent existential question: What happens when quantum computers become powerful enough to crack its cryptography? A new proposal, BIP-360, aims to answer this, potentially clearing the final hurdle for institutional adoption. But is $1 million a real possibility for Bitcoin? For now, the first […]

Exit mobile version