
Should the Bears increase their momentum and break down the support level of $4,988, then Bitcoin price will continue downtrend movement towards $4,742 level. Should the support level of $4,988 hold, BTC may bounce and face the north.
Key Highlights:
- Consolidation is over in the Bitcoin market;
- the Bears took over the BTC market;
- Bitcoin price may fall to $4,742.
BTC/USD Medium-term Trend: Bearish
Resistance levels: $5,299, $5,574, $5,840
Support levels: $4,988, $4,742, $4,491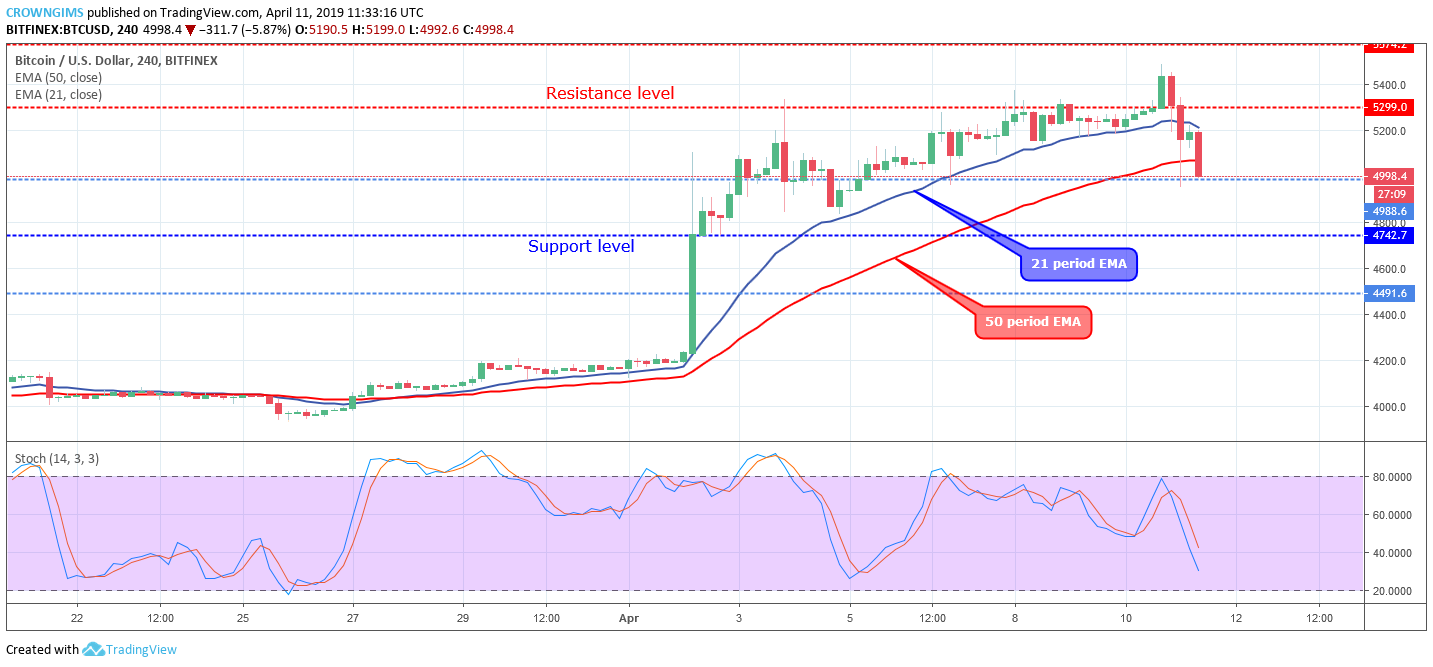

On April 10, the Bulls broke up the resistance level of $5,299 but later opposed by the Bears and the price returned below the $5,299 price level and pressing towards $4,988 price level.
The two EMAs are well separated from each other and Bitcoin price is trading in-between the 21 periods EMA and 50 periods EMA with strong bearish candles this is to indicate bearish momentum is gradually increasing in the BTC market. The Stochastic Oscillator period 14 is at 40 levels with the signal lines bending down which indicate sell signal and a further decrease in Bitcoin price.
Should the Bears increase their momentum and break down the support level of $4,988, then the coin will continue downtrend movement towards $4,742 price level. Should the support level of $4,988 holds, BTC may bounce and face the north.
BTC/USD Short-term Trend: Bearish
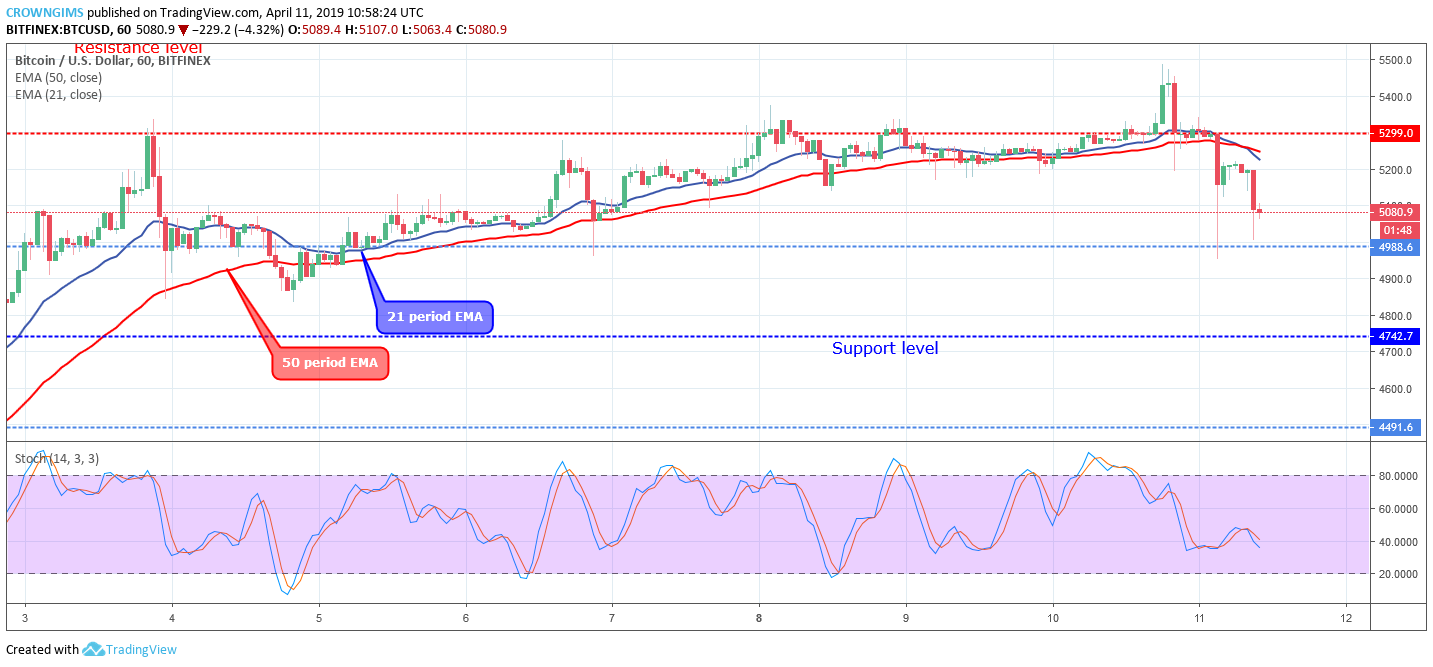
Along the way, a bearish reversal candle pattern formed called evening star and Bitcoin price returned to the south, broke down the confluence at $5,299 level and currently facing the demand level of $4,988.
The 21 periods EMAs has crossed the 50 periods EMA downside as a confirmation of bearish trend and the coin is trading below the two EMAs. In addition, the Stochastic Oscillator period 14 is at 40 levels and the signal lines bending down to indicate sell signal.
next