
The Bulls require higher pressure to break up a resistance level of $5,574 and target $5,716 in case Bitcoin price support level of $5,459 holds. Should the resistance level of $5,574 hold the Bears may take over.
Key Highlights:
- Bitcoin price is currently consolidating on the 4-hour and 1-hour charts;
- the breakup at $5,574 level will expose $5,716 resistance level;
- the Bears may take over in case $5,574 level holds.
BTC/USD Medium-term Trend: Bullish
Resistance levels: $5,574, $5,716, $5,910
Support levels: $5,459, $5,255, $4,988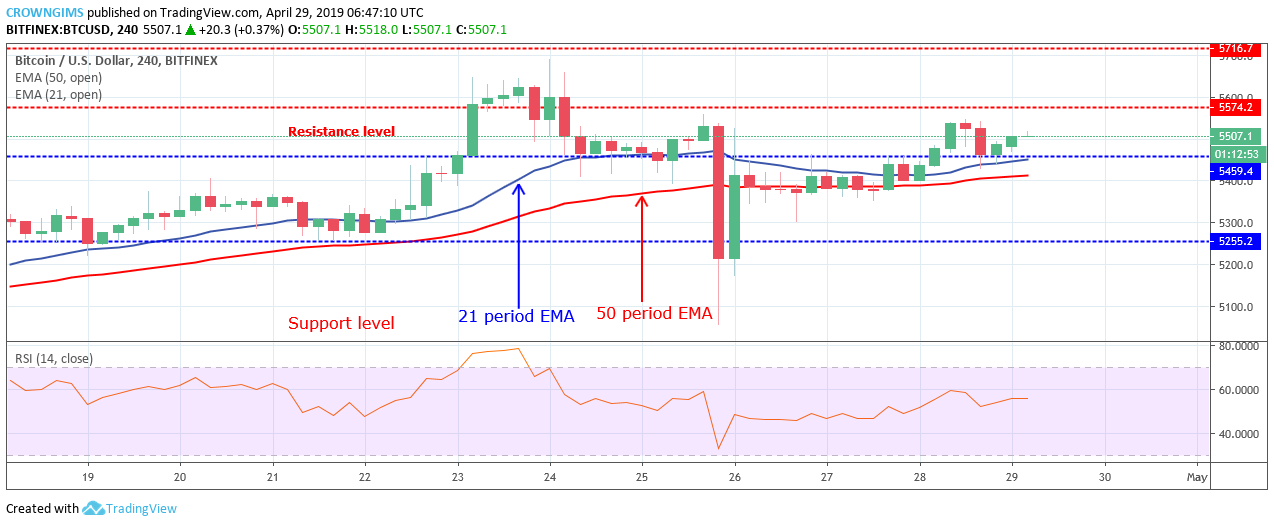

On April 26 another big bullish candle emerged that signaled to the BTC market the increase in the bullish momentum. Shortly after this scenario, there was short consolidation around $5,459 level before the Bulls were able to break up the $5,459.
Bitcoin price is currently trading above the 21 periods EMA and 50 periods EMA and the two EMAs are gradually widening the gap between them; this connotes increase in the Bulls’ pressure. The Relative Strength index period14 is around 60 levels with the signal line showing no significant direction which implies that sideways movement is ongoing in the BTC market.
The Bulls require higher pressure to break up a resistance level of $5,574 and target $5,716 in case the support level of $5,459 holds. Should the resistance level of $5,574 holds the Bears may take over.
BTC/USD Short-term Trend: Ranging
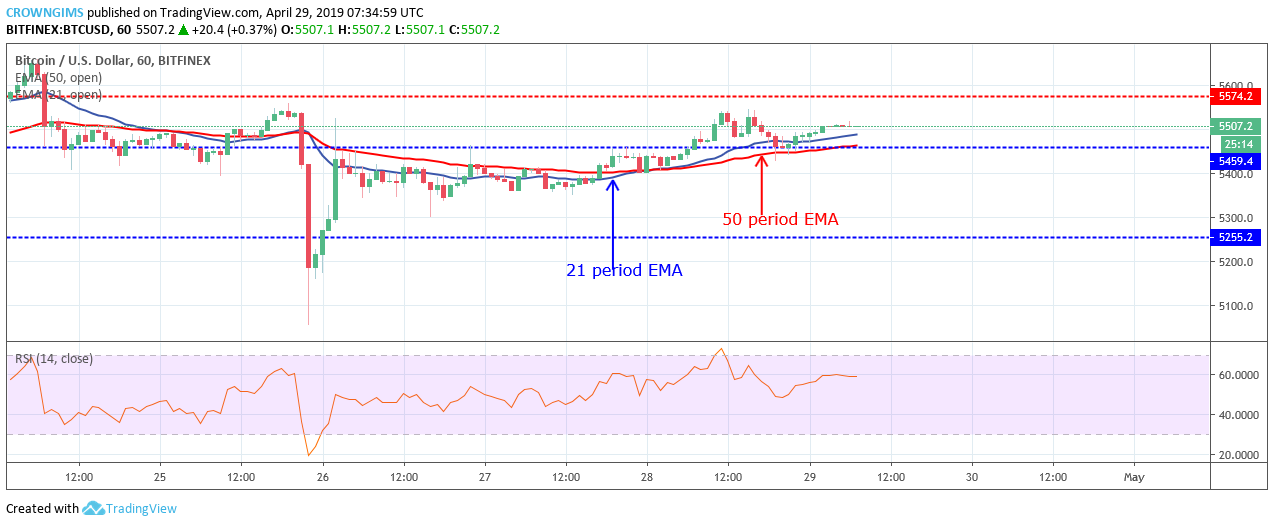
BTC price is trading above the 21 periods EMA and 50 periods EMA with sluggish increase. Meanwhile, the Relative Strength Index period 14 is at 60 levels with the signal lines horizontally flat to indicate that consolidation is ongoing in the BTC market.
next