Bitcoin Price Analysis: BTC/USD Trends of March 04–10, 2019

Updated on Mar 4, 2019 at 7:48 am UTC by · 2 mins read

Only radical fundamental events can make Bitcoin price to break out of the consolidation phase. Increase in the Bears’ momentum will make the coin to rally towards $3,241 in case the Bears’ momentum breaks down the support level of $3,679.

Key Highlights:

  • The breakdown of $3,679 support level will decrease Bitcoin price towards $3,679;
  • in case the bears do not defend the resistance level of $4,337, BTC will find its high at $4,692;
  • the break out is imminent.

BTC/USD Long-term Trend: Ranging

Resistance levels: $4,237, $4,692, $5,209
Support levels: $3,679, $3,241, $2,765BTC/USD is on the sideways movement on the long-term outlook. On February 23, the bullish momentum aided the BTC price to find its high at $4,237. Continuation of Bitcoin price increment was opposed by the bears with the formation of the bearish engulfing candle.

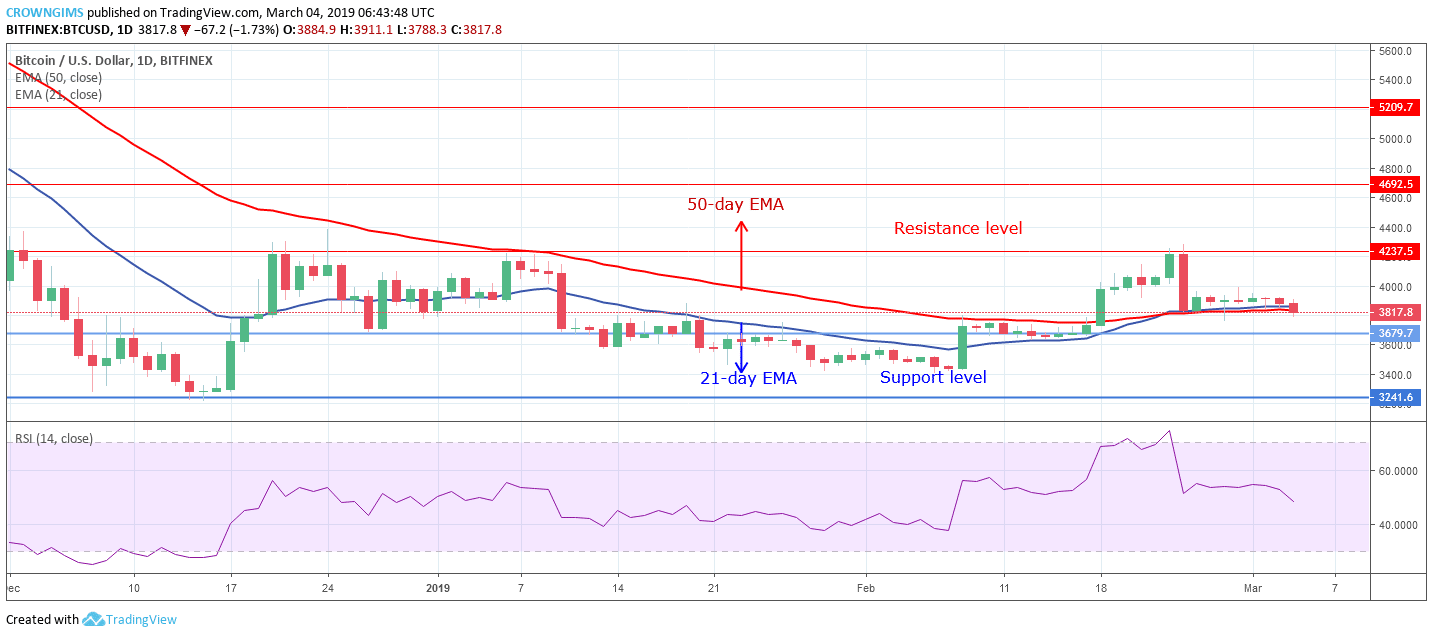
The coin was pushed towards the support level of $3,679 but unable to reach the target before it was rejected at the dynamic support level of 21-day EMA and 50-day EMA. At this spot, both the Bears and the Bulls lost momentum and the BTC price commenced consolidation.

The 21-day EMA has crossed the 50-day EMA up but the two EMAs are flat showing no direction and Bitcoin price ranging directly on the two EMAs indicating that consolidation is ongoing. However, the Relative strength Index period 14 is at 50 levels pointing to the south connotes that the bearish momentum is gradually increasing.

Only radical fundamental events can make Bitcoin price to break out of the consolidation phase. Increase in the Bears’ momentum will make the coin to rally towards $3,241 in case the Bears’ momentum breaks down the support level of $3,679.

BTC/USD Medium-term Trend: Ranging

The Cryptocurrency is ranging on the medium-term outlook. As it can be seen clearly on the 4-Hour chart in the BTC/USD market that the bulls have lost the momentum to drive the coin upward, likewise the Bears have lost the pressure to propel the BTC price downward. The consolidation started on February 24, shortly after the strong bearish candle was opposed by the bulls to prevent further declination of Bitcoin price.

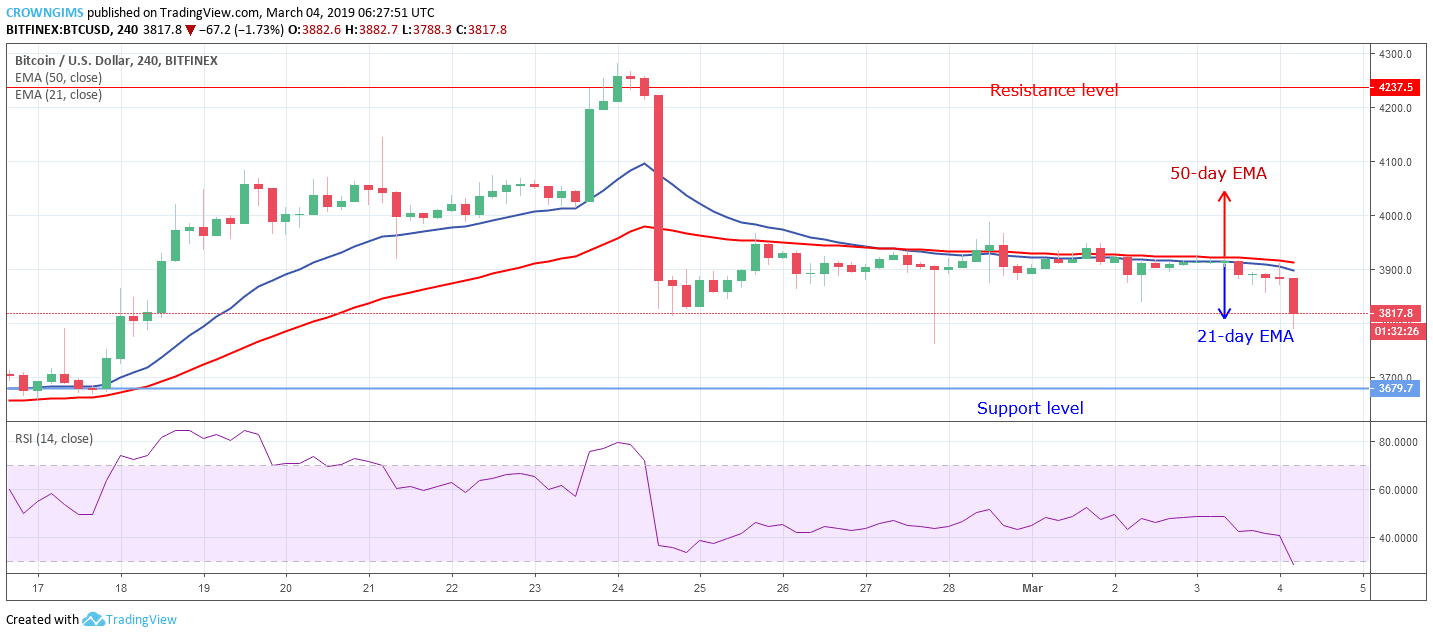
The BTC price is trading below the two EMAs in which the 50-day EMA is above the 21-day EMA. Meanwhile, the Relative Strength Index period 14 is above 20 levels with the signal lines bending down indicate sell signal.

Share:

Related Articles

Bitcoin Hits ‘Deep Value’ as RSI Plummets to 23: Is the High-Conviction Bottom In?

By February 13th, 2026

Bitcoin RSI Hits 23: Analysts Flag ‘Deep Value’ Entry Point

Bitcoin Price Prediction: New Bitcoin Protocol Upgrade Makes BTC More Quantum-Resistant – $1 Million BTC Possible Now?

By February 12th, 2026

Bitcoin’s march toward becoming a global reserve asset has faced one persistent existential question: What happens when quantum computers become powerful enough to crack its cryptography? A new proposal, BIP-360, aims to answer this, potentially clearing the final hurdle for institutional adoption. But is $1 million a real possibility for Bitcoin? For now, the first […]

Robert Kiyosaki Sells Bitcoin and Gold as Crypto Market Loses $750B

By February 6th, 2026

Since Oct. 10, 2025, Bitcoin’s price has fallen about 44%, but US spot Bitcoin ETFs have reduced their BTC holdings by only 6.6%, showing major strength.

Exit mobile version