
The Bitcoin bullish rally will be anticipated in case there is a strong bullish candle that breaks and closes above the resistance level of $3,726.
Key Highlights:
- Consolidation is ongoing;
- bears were still in control of Bitcoin market;
- break out is imminent;
BTC/USD Long-term Trend: Ranging
Resistance levels: $3,726, $4,426, $5,070
Support levels: $3,094, $2,261, $1,500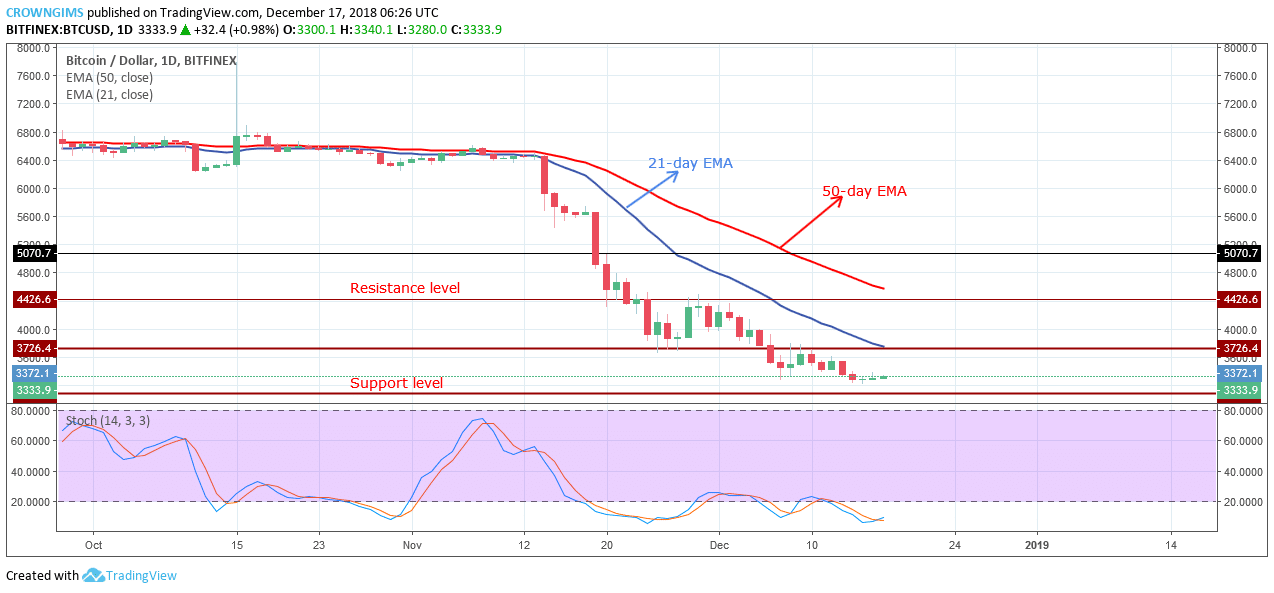

There was a slightly bearish push towards the lower bound of the range in which the bears were unable to break out the downside, neither the bulls were able to break out upside. Nevertheless, the coin is still under bears’ pressure.
The 21-day EMA and 50-day EMA are above the Bitcoin price at a distance to each other confirm the domination of the bears on the BTC market. The Stochastic Oscillators period 14 is at oversold zone (below 20 levels) with signal lines interlocked indicates that Bitcoin’s price may possibly face consolidation movements during the next few trading sessions.
As the BTC market remains flat, traders may wait for the breakout before taking a position. The bullish rally will be anticipated in case there is a strong bullish candle that breaks and closes above the resistance level of $3,726.
BTC/USD Medium-term Trend: Bearish
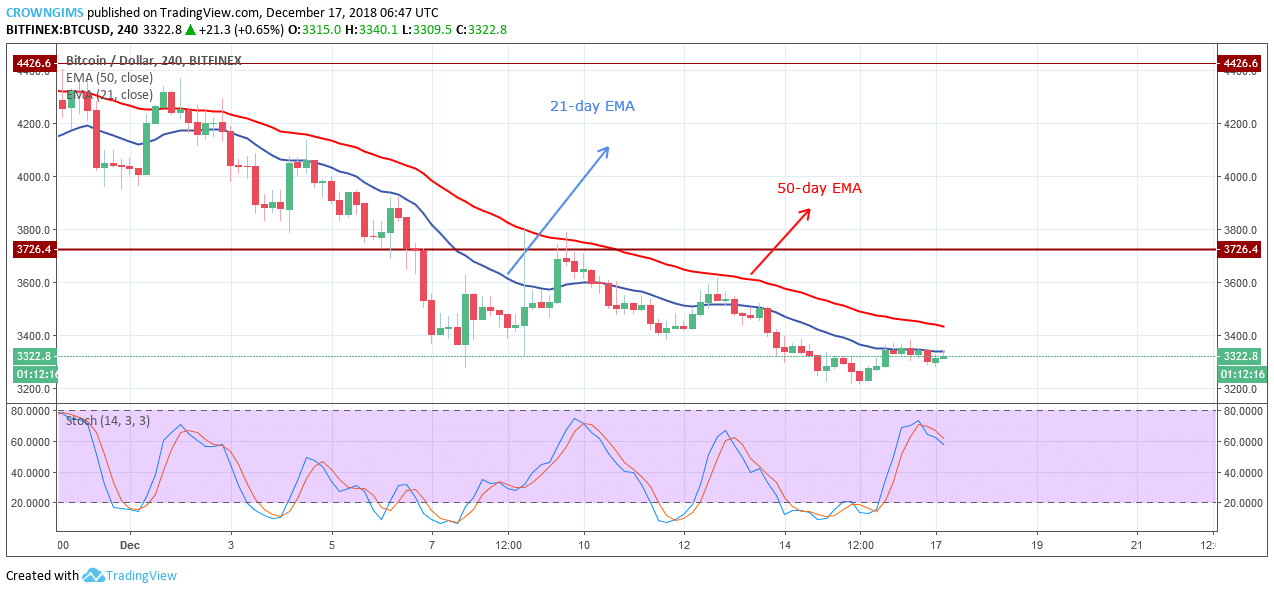
The BTC price is below the 21-day EMA and 50-day EMA and the two EMAs well separated from each other indicates that the bears were still in control of BTC market. The stochastic Oscillator period 14 is at 60 levels with signal lines pointing south which connotes the sell signal. A breakout below the support level of $3,094 will further decline in price towards $2,261 – $1,500 price level.
next