Bitcoin Price Analysis: BTC/USD Trends of December 3–9, 2018

Updated on Apr 28, 2022 at 11:13 am UTC by · 2 mins read

The traders should watch out for the breakout before taking the position. Should the bulls defend the $3,949 price level, the Bitcoin price may rally to the north and have its target at $5,084 – $5,667.

Key Highlights:

  • Consolidation is ongoing on the Bitcoin market;
  • break out is imminent;
  • traders should remain flat.

BTC/USD Long-term Trend: Ranging

Distribution Territories: $4,447, $5,084, $5,667
Accumulation Territories: $3,949, $3,652, $3,450Ranging movement in the Bitcoin market on the long-term outlook; on the daily chart above BTC price is consolidating between the key distribution territories of $4,447 and an accumulation territory of $3,949. After BTC price pulled back from the accumulation territory of $3,652, the bulls lost the pressure and could not break the distribution territory of $4,447.

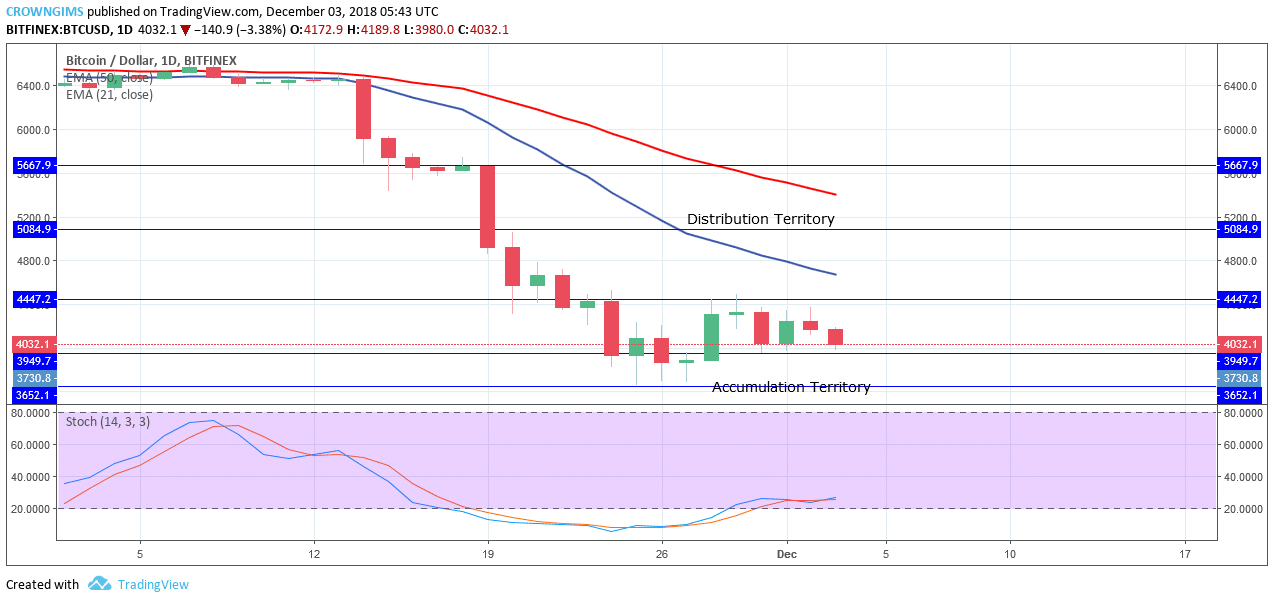
Bitcoin price remains bearish as long as it is contained below the 21-day EMA and 50-day EMA. The Stochastic Oscillator is above 20 levels (oversold region) with the two signal lines interlocked and flat to the level without direction which indicates consolidation is ongoing. In case the accumulation territory of $3,949 is broken by the bears BTC price may have its low between the accumulation territory of $3,652 and $3,450.

Should the bulls defend the $3,949 price level, the Bitcoin price may rally to the north and have its target at $5,084 – $5,667 price level. The traders are advised to watch out for the breakout before taking the position.

BTC/USD Medium-term Trend: Ranging

BTC/USD is ranging on 4-Hour chart. On November 28, BTC price reached the high of $4,447 distribution territory and the price bounced back and then began to range between the distribution territory of $4,447 and the accumulation territory of $3,949 and the two EMAs were flat to confirm the ranging movement.

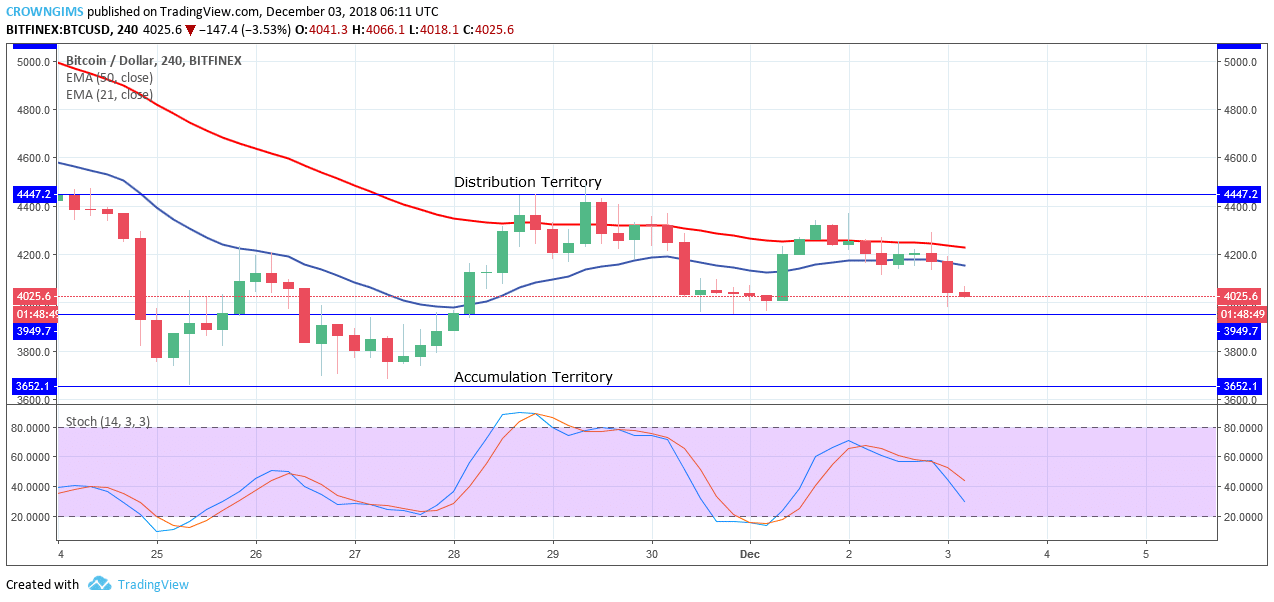
The Bitcoin price remains below the 21-day EMA and 50-day EMA and the Stochastic Oscillator period 14 is at 40 levels with the signal lines point to the south connotes sell signal in which if the bears increase their pressure and a breakout downside the accumulation territory of $3,949, BTC price may have its low at $3,652 – $3,450.

Share:

Related Articles

Michael Saylor Hints at Strategy’s 100th Bitcoin Purchase Milestone

By February 23rd, 2026

Michael Saylor Hints at Strategy’s 100th Bitcoin Purchase

Bitcoin Hits ‘Deep Value’ as RSI Plummets to 23: Is the High-Conviction Bottom In?

By February 13th, 2026

Bitcoin RSI Hits 23: Analysts Flag ‘Deep Value’ Entry Point

Bitcoin Price Prediction: New Bitcoin Protocol Upgrade Makes BTC More Quantum-Resistant – $1 Million BTC Possible Now?

By February 12th, 2026

Bitcoin’s march toward becoming a global reserve asset has faced one persistent existential question: What happens when quantum computers become powerful enough to crack its cryptography? A new proposal, BIP-360, aims to answer this, potentially clearing the final hurdle for institutional adoption. But is $1 million a real possibility for Bitcoin? For now, the first […]

Exit mobile version