
In case the demand level of $3,679 holds and the Bulls gained enough momentum, there will be a bullish rally towards the resistance levels of $4,237-$4,692. The breakdown of the $3,679 level will return the Bitcoin price to the previous low of $3,247.
Key Highlights:
- The bulls have taken over Bitcoin market on 4-Hour chart;
- the previous low level may be reached in case $3,679 level does not hold;
- the BTC price may rise.
BTC/USD Long-term Trend: Bearish
Resistance levels: $4,237, $4,692, $5,600
Support levels: $3,679, $3,247, $2,765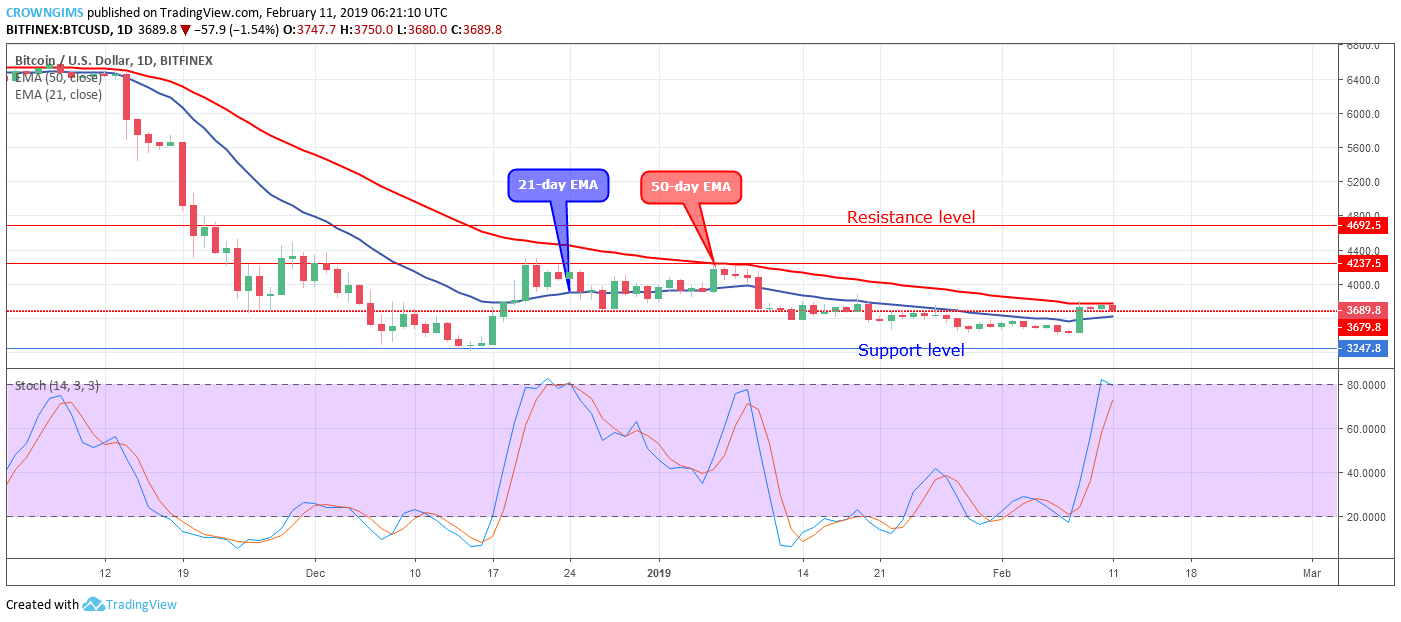

BTC price is currently trading in between the 21-day EMA and 50-day EMA and the two EMAs were gradually coming closer to each other as an indication that consolidation is ongoing on the daily chart in the BTC market. However, the Stochastic Oscillator period 14 is at 80 levels and the signal lines pointing down which implies sell signal.
The coin is in between tight barriers which require strong bearish or bullish momentum for it to rally. In case the demand level of $3,679 holds and the Bulls gained enough momentum, then, there will be a bullish rally towards the resistance levels of $4,237 – $4,692. Alternatively, the breakdown of the $3,679 price level will return Bitcoin price to the previous low of $3,247.
BTC/USD Medium-term Trend: Bullish
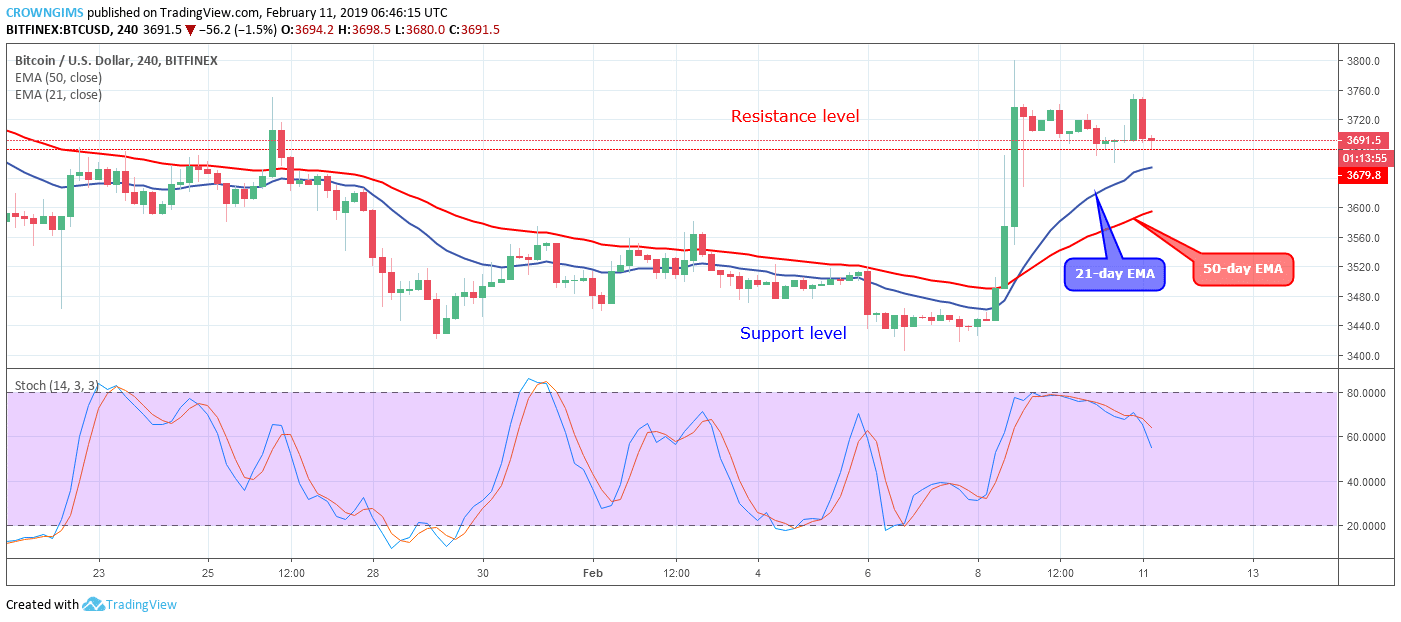
There was a sudden bullish breakout of the coin in which the BTC price rallied towards the resistance level of $3,679 after broken up the two dynamic resistances. The BTC price penetrated the resistance level upside and commenced consolidation.
The 21-day EMA has crossed the 50-day EMA upside and the BTC price is above the two EMAs which confirms the change in trend from bearish to bullish. Nevertheless, the Stochastic Oscillator period 14 is at 40 levels with its signal line pointing down indicate sell signal.
next