Bitcoin Price Analysis: BTC/USD Trends of January 7–13, 2019

Updated on Apr 28, 2022 at 11:15 am UTC by · 2 mins read

The bullish rally of the Bitcoin price is not certain until the coin breaks out at the resistance level of $4,249 and retests the level.

Key Highlights:

  • Bitcoin price remains on sideways movement within the range;
  • the bulls pushed up the BTC price towards $4,249 price level;
  • the break out is imminent on the BTC market.

BTC/USD Long-term Trend: Ranging

Resistance levels: $4,249, $4,715, $5,424
Support levels: $3,679, $3,247, $2,765Bitcoin Price Analysis: BTC/USD Trends of January 7–13, 2019The cryptocurrency remains on the consolidating phase on the long-term outlook. Throughout last week the Bitcoin price remains to trade on the 21-day EMA without any significant movement. Both the bears’ pressure and the bulls’ pressure were still at equilibrium; the BTC is still range-bound between the resistance level of $4,249 and the support level of $3,677. The Bulls made an attempt to penetrate the resistance level of $4,249 on January 6 with the formation of a strong daily bullish candle but resisted by the confluence at the mark.

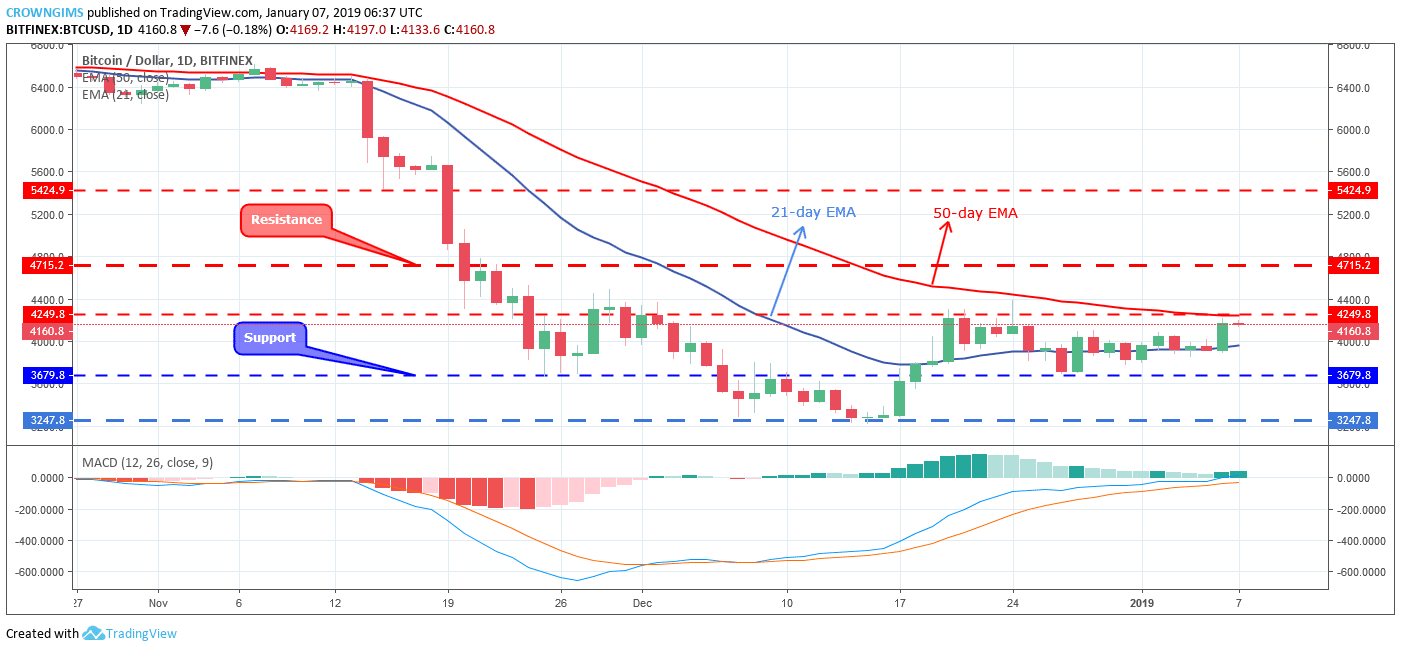
At the moment of writing, Bitcoin price is trading in between 21-day EMA and 50-day EMA which indicate that sideways movement is ongoing. The MACD period 12 is above the zero levels with its histogram flat on the level and the signal lines horizontally placed and flat on the zero level which connotes that ranging movement may continue for short period. The bullish rally of the Bitcoin price is not certain until the coin breaks out at the resistance level of $4,249 and retests the level. Certainly, break out is imminent.

BTC/USD Medium-term Trend: Bullish

Bitcoin Price Analysis: BTC/USD Trends of January 7–13, 2019BTC/USD is bullish on the medium-term outlook. BTC price has been on sideways movement for more than a week hovering over and on the two EMAs within the range of $4,249 resistance level and $3,679 support level. There was a strong bullish push towards the $4,249 price level with the formation of a strong massive bullish candle but unable to break through the resistance level. It seems the pullback is ongoing as the weak bearish candles were emerging.

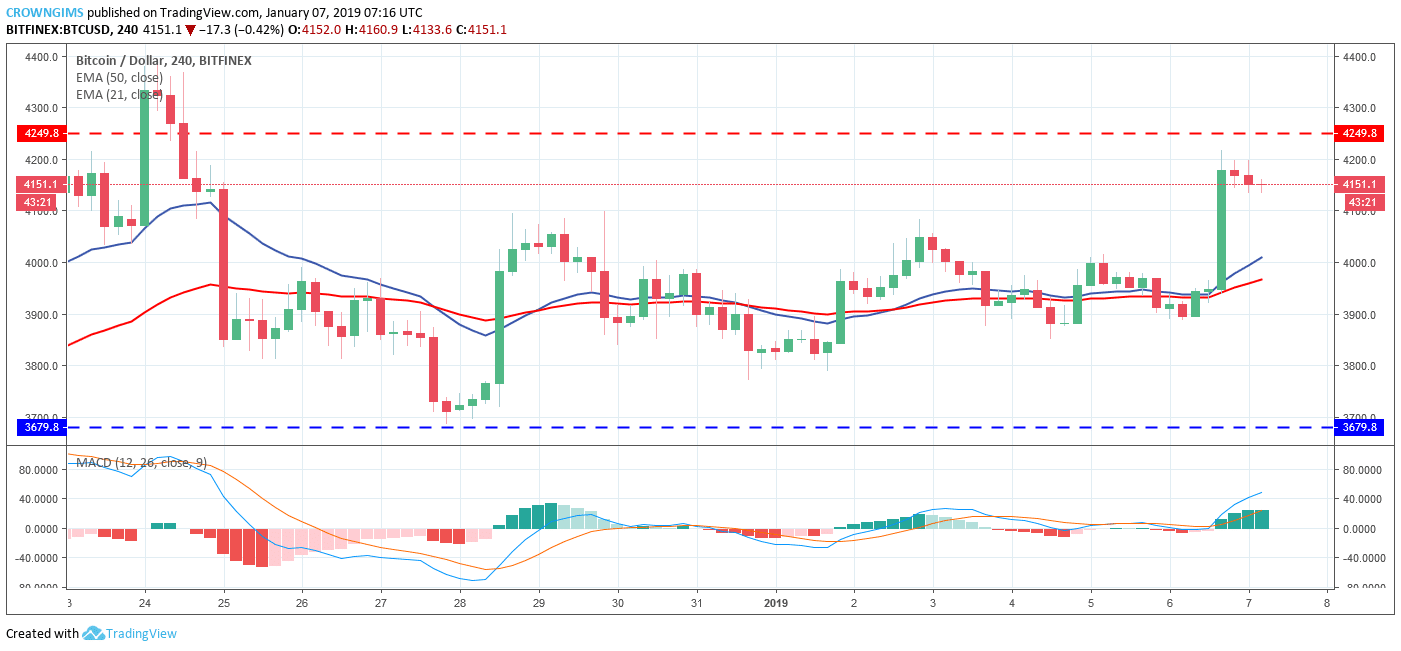
The 21-day EMA has crossed above the 50-day EMA with the Bitcoin price trading above the two which indicates the strength of buyers. The MACD period 12 with its histogram is above the zero levels and the signal lines pointing to the north indicate buy signal.

Share:

Related Articles

Bitcoin Suisse Bags Regulatory Approval in Abu Dhabi Expansion Move

By May 21st, 2025

Bitcoin Suisse has secured key approval in Abu Dhabi, paving the way for full licensing and expansion into the Middle East crypto market.

Strive Goes All-In on Bitcoin: Is BTC New Corporate Safe Haven?

By May 21st, 2025

Strive Asset Management is making a bold bet on Bitcoin, aiming to build a 75,000-BTC treasury through discounted Mt. Gox claims.

Bitcoin Hits Major Milestone as BTC Price Hits $107K, New ATH Soon?

By May 21st, 2025

Bitcoin has broken above $107,000 as its realized cap hits an all-time high while governments quietly boost exposure through Strategy shares.

Exit mobile version