
Cardano price may rally towards the supply zone of $0.042 in case the bulls defend the demand zone of $0.027.
Key Highlights:
- There is a sideways movement on the Cardano market;
- the Bulls may take over the market;
- the break out is imminent.
ADA/USD Price Long-term Trend: Ranging
Supply Zones: $0.032, $0.042, $0.050
Demand Zones: $0.027, $0.022, $0.016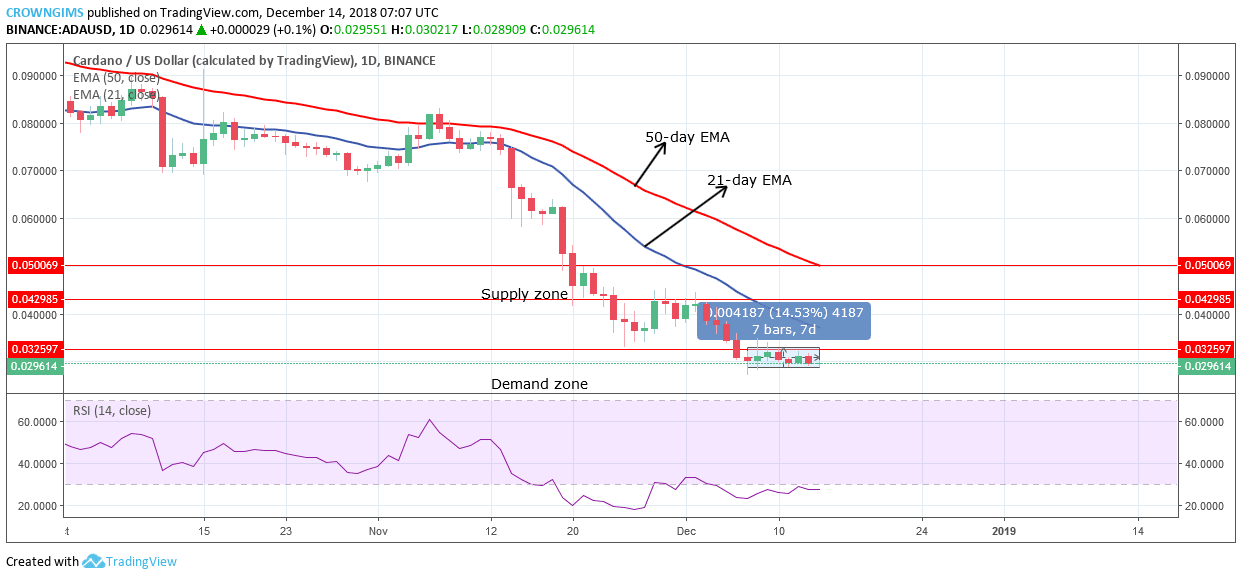

The coin remains in the bearish trend zone as long as it remains below the 21-day EMA and 50-day EMA with the two EMAs fanned apart and a distance from the coin indicates that the bearish pressure is strong. The Relative strength index (RSI) period 14 is at the oversold region (below 20 levels). It indicates that the bearish momentum on ADA market is high and also connotes a sell signal. Cardano will have its low at $0.022 in case the bears increase its momentum and break out $0.027 downside.
ADA/USD Price Medium-term Trend: Ranging
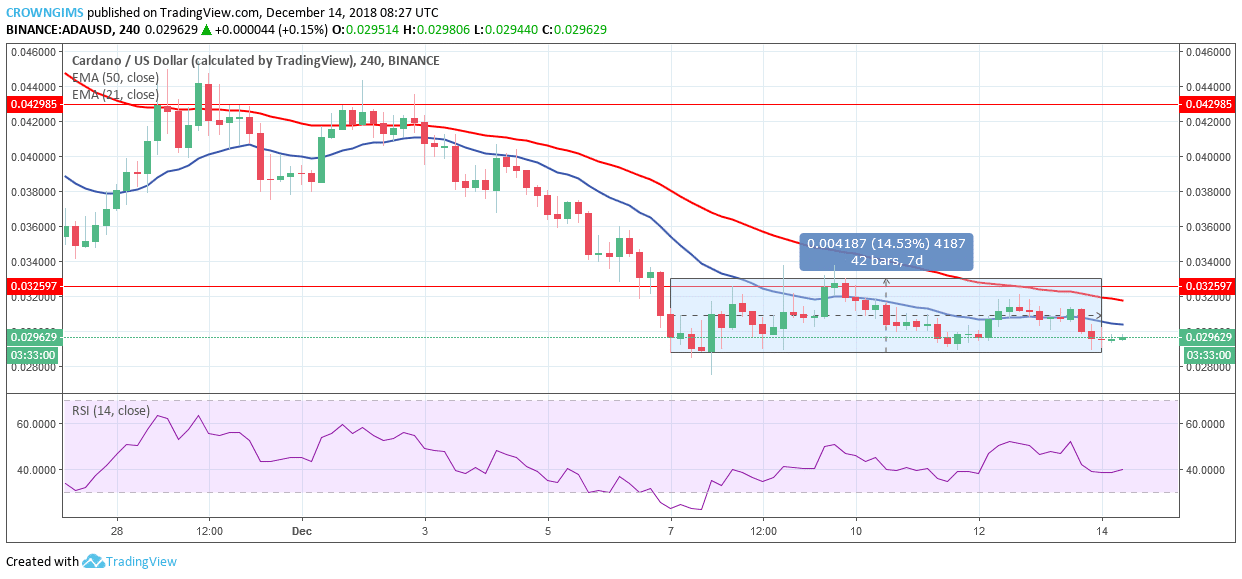
Currently, Cardano price is moving up and down on the 21-day EMA and 50-day EMA; this confirms the sideways movement on the ADA market. The Relative Strength Index period 14 is at 40 levels parallel to the level without direction, which indicates that consolidation is ongoing and it may continue for a short period of time. ADA price may rally towards the supply zone of $0.042 in case the bulls defend the demand zone of $0.027.
next