
Cardano price may find its support at the previous low of $0.030 in case the bears maintain or gain more pressure to drive the coin downward but bearish momentum failure may lead to a change of trend direction.
Key Highlights:
- Cardano broke out of consolidation mode;
- the Bears prevailed over the bulls;
- the Bearish trend may continue.
ADA/USD Price Long-term Trend: Bearish
Supply Zones: $0.042, $0.050, $0.058
Demand Zones: $0.030, $0.021, $0.011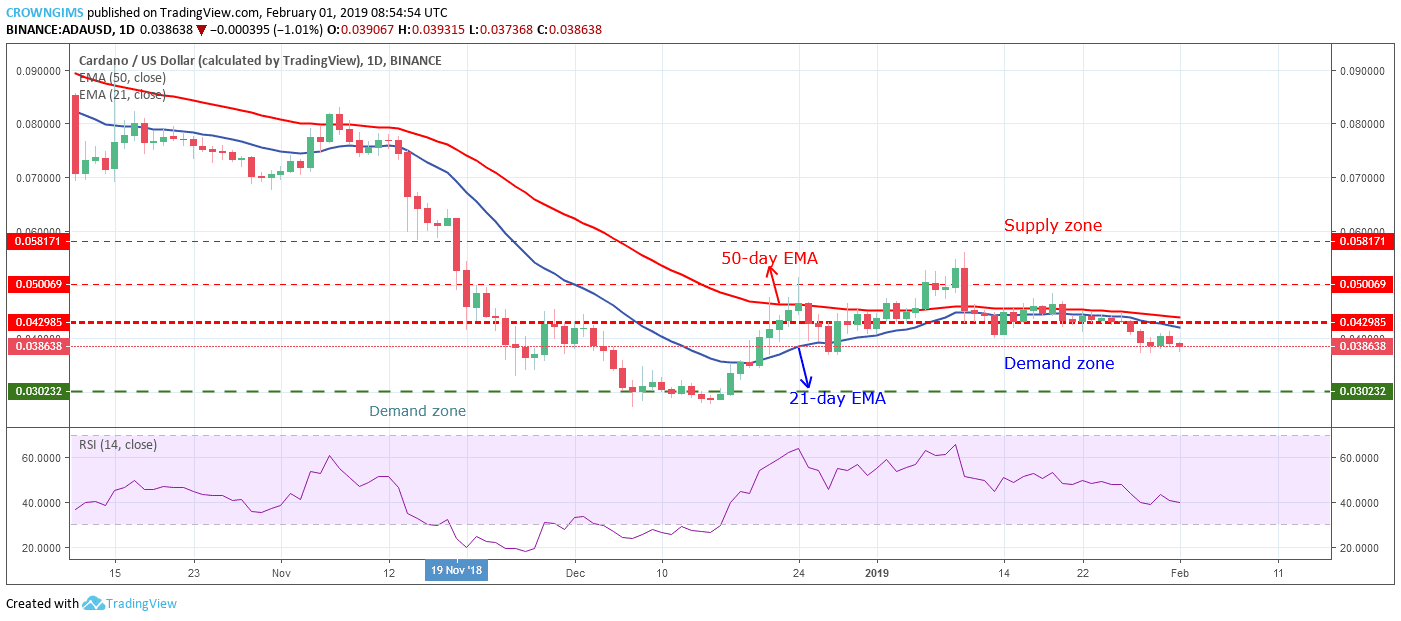

ADA price decreased towards the $0.030 price level; that is Cardano price is currently facing another significant demand zone which may require higher momentum to penetrate. Presently, the bears were in control of the Cardano market.
The two dynamic resistance and support (21-day EMA and 50-Day EMA) are above the ADA price as a sign of a bearish trend with the two EMAs bending down to follow the trend. The Relative Strength Index is at 40 levels and the signal line pointing to the south indicates a high probability of bearish trend continuation.
Cardano price may find its support at the previous low of $0.030 in case the bears maintain or gain more pressure to drive the coin downward but bearish momentum failure may lead to a change of trend direction.
ADA/USD Price Medium-term Trend: Ranging
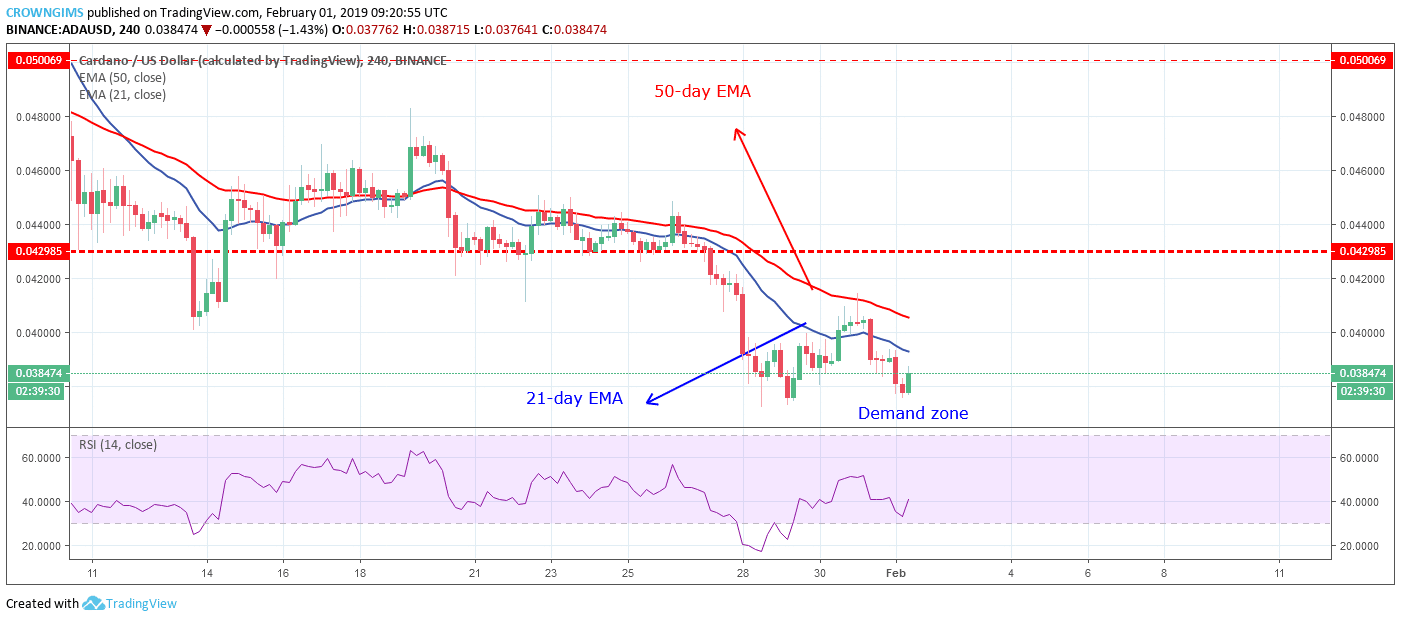
ADA price is trading below the 21-day EMA and 50-day EMA. The Relative Strength Index period 14 is at 40 levels with signal lines pointing up which indicates the buy signal.
next