
Crypto market cap fell below $3 trillion amid yen strength, while key assets show signs of undervaluation.
The broader cryptocurrency market is facing renewed selling pressure, with total market capitalization falling below $3 trillion.
The rise in the Japanese yen has reignited fears of a yen carry trade unwind, pushing risk-on assets like cryptocurrencies lower while safe-haven assets such as gold and silver rally.
On-chain data, however, suggests the crypto market may be undervalued.
Crypto Market Undervaluation Signals Appear
In the last 24 hours, the crypto market has faced additional selling pressure, losing the $3 trillion support levels.
As per Coinglass data, the liquidations have topped over $670 million, with over 85% share of long liquidations.
Blockchain analytics firm Santiment showed that the 30-day Market Value to Realized Value (MVRV) metric highlights a more favourable risk profile.
A negative 30-day MVRV suggests the average trader is currently holding at a loss, which can create potential entry opportunities as profits remain below typical “zero-sum” equilibrium levels.
📊The lower a coin's 30-day MVRV is, the less risk there is in opening or adding on to your position.
➖ A coin having a negative percentage means average traders you're competing with are down money, and there is an opportunity to enter while profits are below the normal… pic.twitter.com/YH8y4IzkWc
— Santiment (@santimentfeed) January 26, 2026
A positive 30-day MVRV indicates that traders are in profit, increasing the likelihood of profit-taking.
According to Santiment, the 30-day MVRV for major altcoins such as Ethereum ETH $2 057 24h volatility: 0.8% Market cap: $247.93 B Vol. 24h: $18.84 B , XRP XRP $1.38 24h volatility: 1.4% Market cap: $84.12 B Vol. 24h: $1.95 B , Chainlink LINK $9.02 24h volatility: 0.6% Market cap: $6.37 B Vol. 24h: $301.91 M , and Cardano ADA $0.26 24h volatility: 1.5% Market cap: $9.63 B Vol. 24h: $350.56 M currently sits in negative territory, ranging from -5% to -10%.
Data from 10x Research shows that Bitcoin’s BTC $70 114 24h volatility: 0.6% Market cap: $1.40 T Vol. 24h: $42.68 B daily stochastic indicators are at very low levels of 15-16%, suggesting that the asset is currently in extremely oversold territory.
Is this a “Buy the Dip” Market? And Why Many Portfolios Are About to Find Out
Why this report matters
Most crypto portfolios are positioned as if the next move is obvious.
It isn’t.
Behind the headlines, several signals that rarely align are starting to conflict, political… pic.twitter.com/AZhOtjDVzs
— 10x Research (@10x_Research) January 25, 2026
Despite the oversold reading, Bitcoin has been trending lower since reaching peaks above $125,000 in mid-2025, with the white price line (left-hand scale) showing a consistent downward bias over recent months.
Is a Gold-to-Bitcoin Shift on the Horizon?
Market analysts said a potential rotation from gold into Bitcoin is becoming increasingly likely, citing a major drop in the BTC-to-gold ratio.
According to the image below, the BTC/gold ratio is displaying a rare historical outlier, which suggests a major imbalance between the two assets.

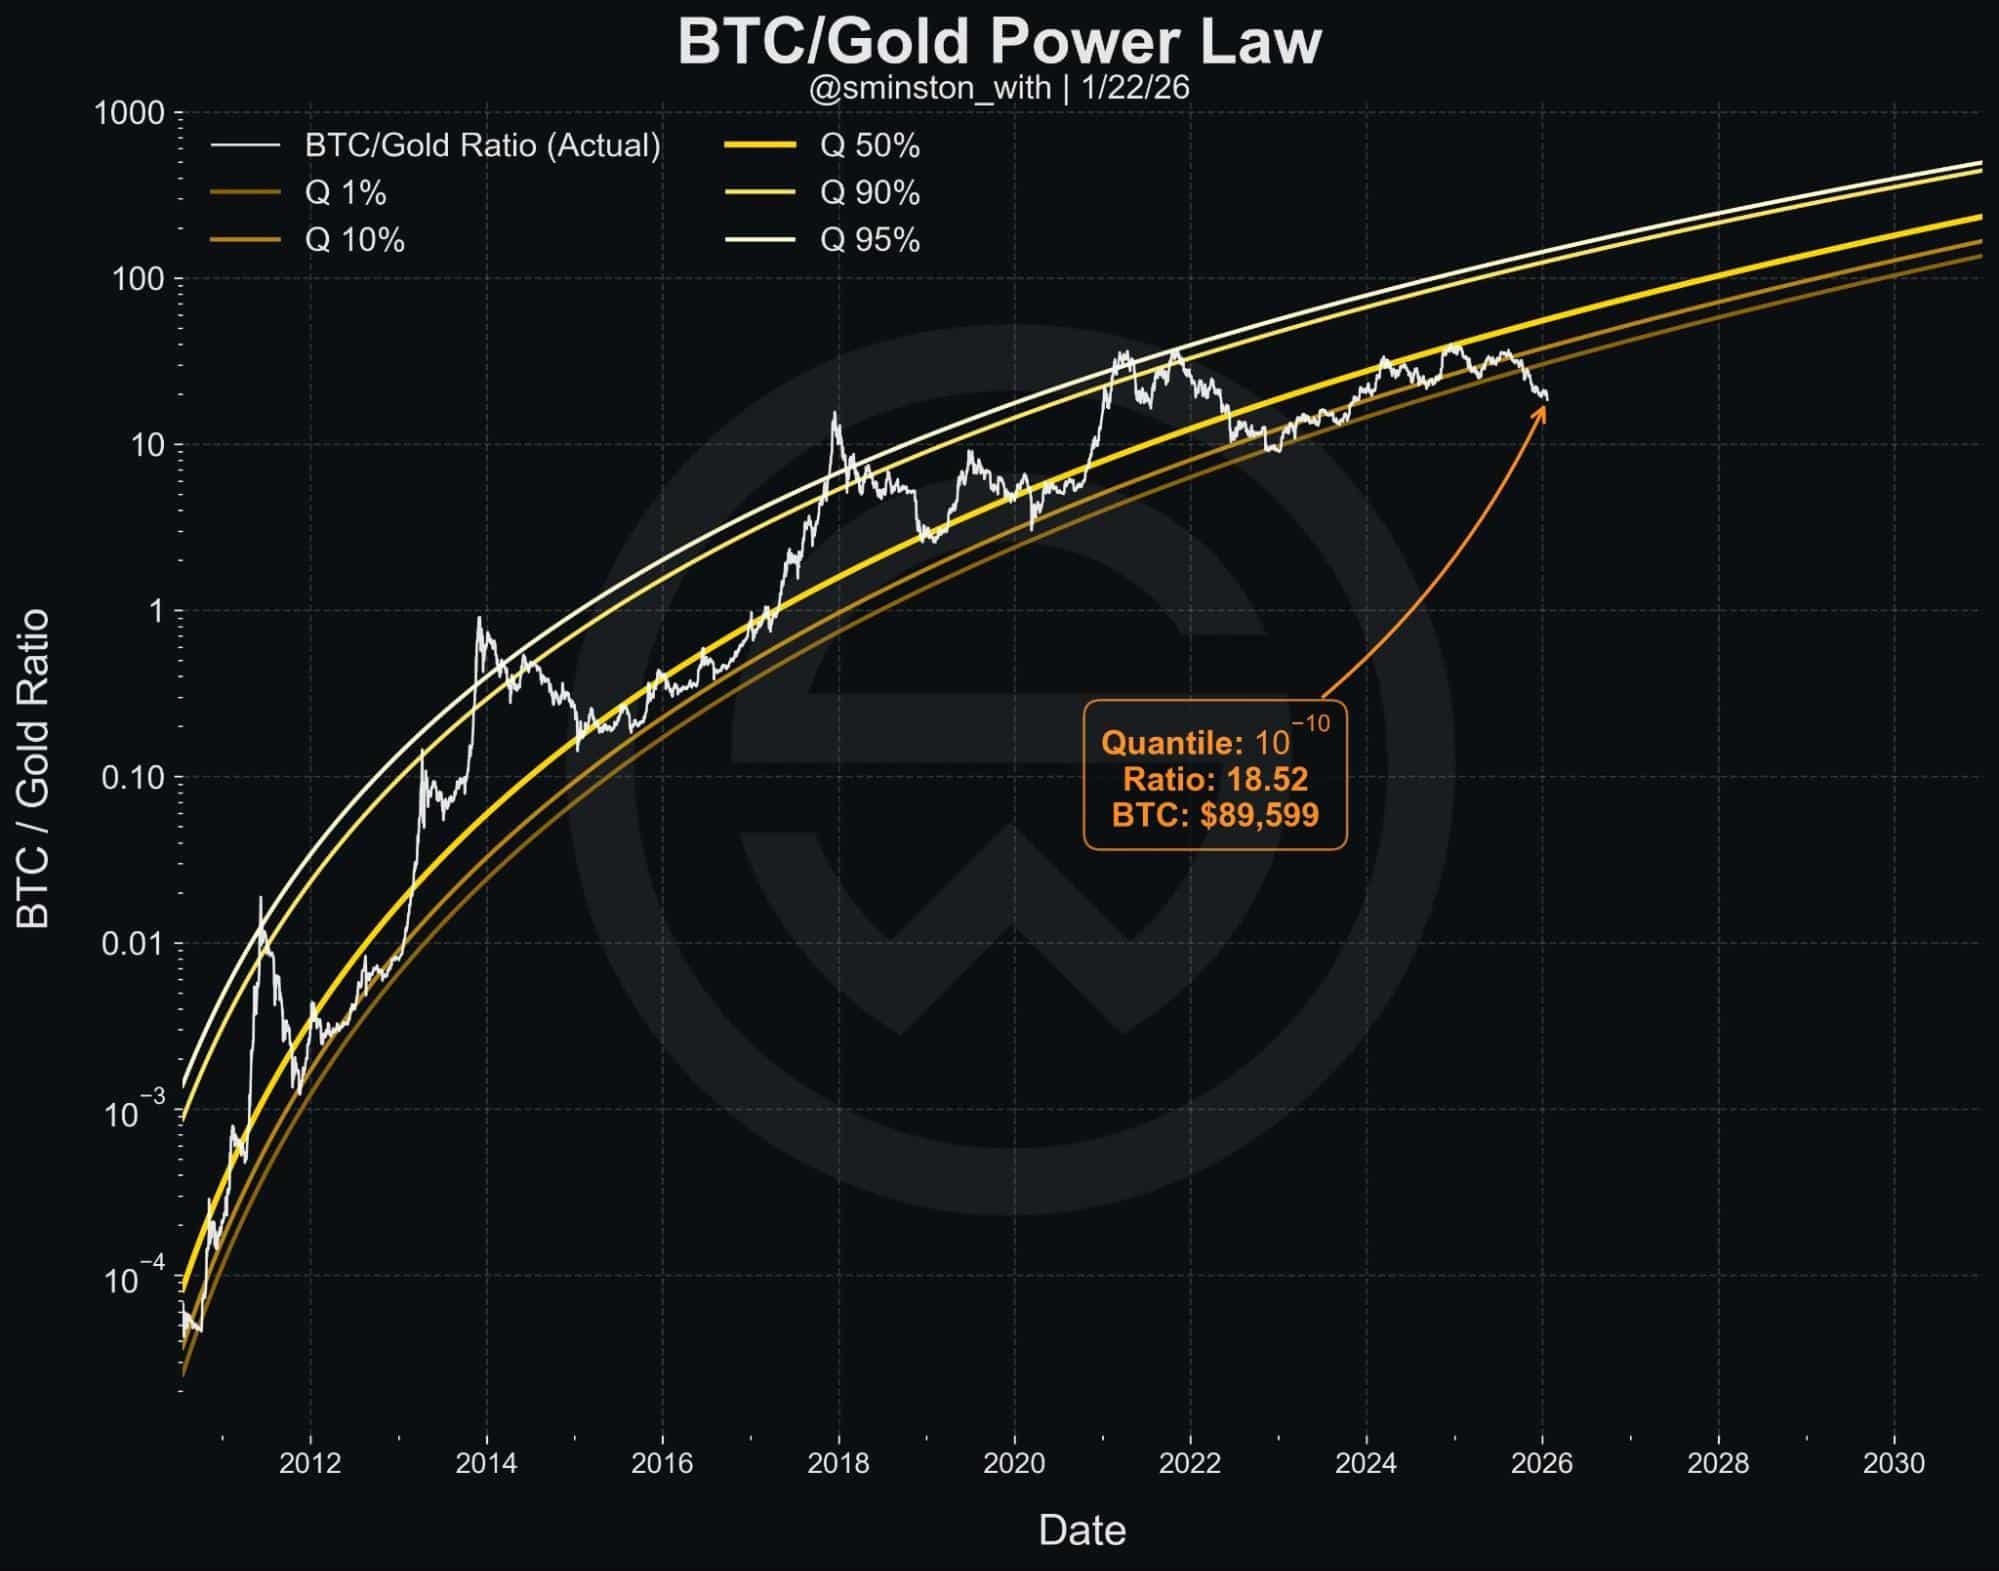
Bitcoin-to-Gold ratio. | Source: CryptosRus
Earlier today, gold prices rose above $5,000 for the first time amid ongoing macroeconomic uncertainty.
Analysts expect that for the BTC-to-gold ratio to return to equilibrium, capital will need to rotate from gold into Bitcoin.
next