Ether has come out of its months-long stagnation with a sudden 17% surge to $2,249, driven by bold whale activity.
Ethereum ETH $2 119 24h volatility: 2.5% Market cap: $255.90 B Vol. 24h: $16.94 B has finally snapped out of its months-long consolidation, posting a massive 17% surge in the past 24 hours to trade at $2,249. The move comes as a surprise to many in the community who had been criticizing ETH’s stagnation below $2,000 since early March.
The rally has also triggered a 108% spike in trading volume, now totaling $38.4 billion — a sign of renewed investor interest.
Popular crypto analyst Ali Martinez pointed out on X that Ethereum is again testing the $2,100-$2,300 range — a critical zone that has acted as both support and resistance for the token.
This is a very important level for #Ethereum $ETH! pic.twitter.com/c0pWVssYY3
— Ali (@ali_charts) May 9, 2025
This is the fifth time ETH has hit this level in the past year. “Clearing $2,380 could ignite a new bull rally,” Martinez wrote. Crypto trader Mister Crypto also echoed bullish sentiment, stating it’s “time for a massive rally.”
Adding weight to that narrative, data from LookonChain revealed that a crypto whale opened a massive long position on ETH. The investor transferred 8.58 million USDC into Hyperliquid with 2x leverage and later added another 8.88 million USDC.
This whale seems extremely bullish on $ETH!
He just deposited another 8.88M $USDC to add to his $ETH long position.
His current position has reached 17,702 $ETH($36.3M), with an unrealized profit of over $1.4M.https://t.co/VCde0KmqRbhttps://t.co/vBLsnd0EA1 pic.twitter.com/IXoHLo26YN
— Lookonchain (@lookonchain) May 8, 2025
The position now stands at 17,702 ETH worth $36.3 million, a clear signal of growing confidence among big investors.
Eth price outlook
The current Ether price zone mirrors levels seen in November 2023, which eventually led a rally to over $4,000. If history repeats, the second-largest cryptocurrency might be setting up for another explosive move.
On the daily chart, ETH has seen a sharp breakout above the upper Bollinger Band, indicating strong upward momentum. If the price drops to the mid band (20-day SMA), traders could see a short-term consolidation. Key support lies at the lower band around $1,825.

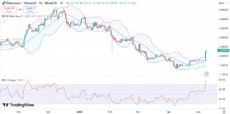
ETH price chart with RSI and Bollinger bands | Source: TradingView
The RSI stands at 79, firmly in overbought territory. While this could indicate a potential pullback, sustained RSI levels often accompany strong bull phases.
Meanwhile, the MACD has confirmed a bullish crossover, with the MACD line moving sharply above the signal line.

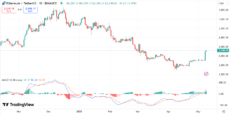
ETH price chart with MACD | Source: TradingView
The bull case is also supported by increasing histogram bars. If ETH breaks above the critical resistance at $2,380, it could trigger a rally toward $2,600 and beyond.
next