
Further increase in the Bullish pressure will penetrate the supply zone of $149 and may target $161 price level. On the other hand, in case the Bulls lose their pressure Ethereum price may continue ranging towards $134 demand zone.
Key Highlights:
- The Bulls momentum gradually increasing on the 4-hour chart;
- the break out from the descending triangle is imminent;
- Ethereum consolidation is ongoing on the 1-hour chart.
ETH/USD Medium-term Trend: Bullish
Supply Zones: $149, $161, $170
Demand Zones: $134, $125, $113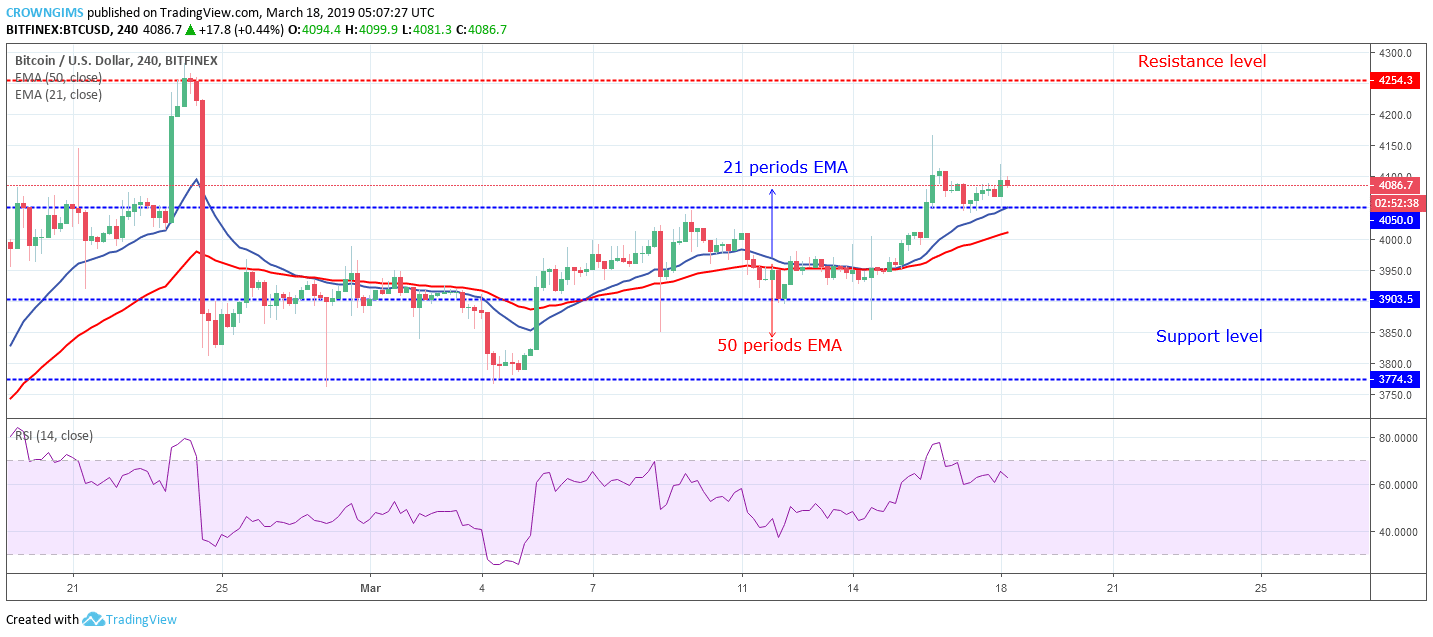

Ethereum price is trading on and within the 21 periods, EMA and 50 periods EMA and the two EMAs have separated from each other shows that the coin is on a bullish trend. The Relative Strength period 14 is above 50 levels with the signal lines pointing up indicates the buy signal and further increase in the ETH price.
Further increase in the Bullish pressure will penetrate the supply zone of $149 and may target $161 price level. On the other hand, in case the Bulls lose their pressure the coin may continue ranging towards $134 demand zone.
ETH/USD Short-term Trend: Bearish
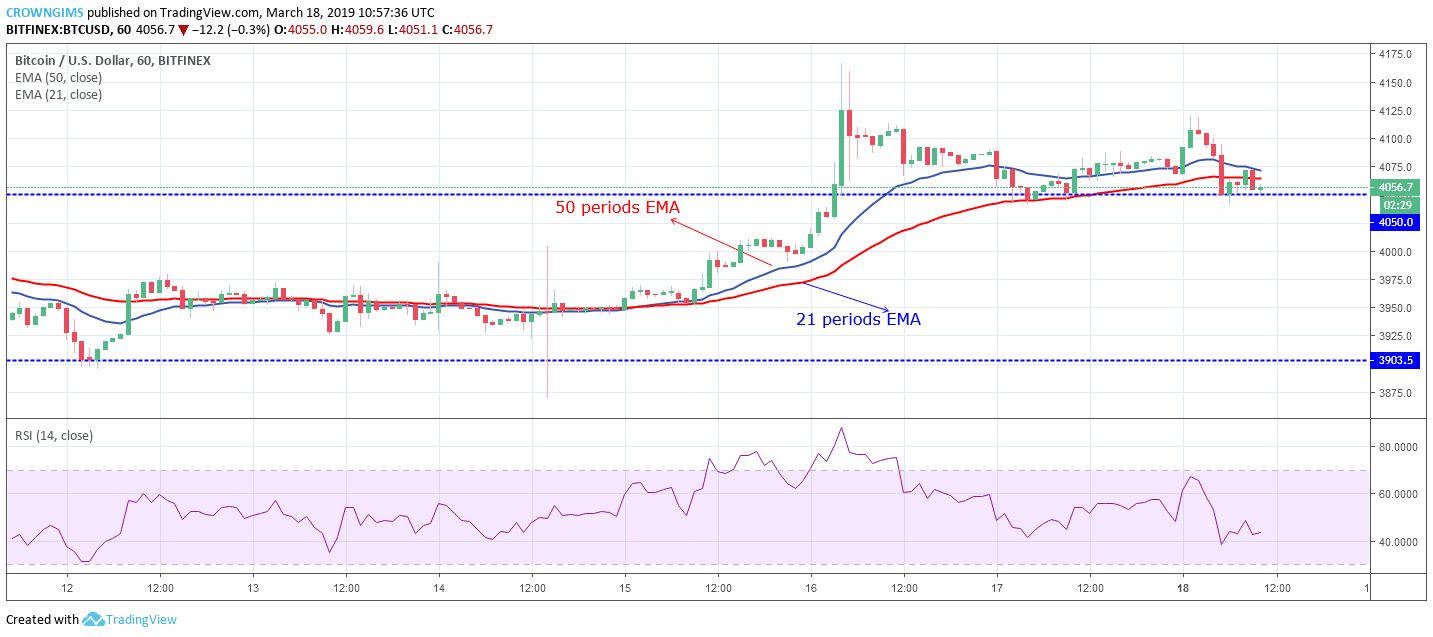
ETH price remains under the bearish pressure as it is currently ranging below the 21 periods EMA and 50 periods EMA. There is a tendency for the break out either at the upper or lower trend line of the triangle. The Relative Strength Index period 14 is above 50 levels with the signal lines pointing up to indicate buy signal.
The bullish breakout will make $149 price level as the ETH target while the demand zone of $134 will be the ETH target for a bearish breakout.
next