
In case Ethereum price goes down below $134 with the bearish candle close below the level right down there, then the bears will drive ETH price towards $125 price level. If there is a rejection at $134, then the ranging movement may continue.
Key Highlights:
- The Bears are gradually taking over the control of Ethereum market;
- ETH price is targeting $125 price level;
- consolidation may continue in case the $134 level holds.
ETH/USD Medium-term Trend: Bearish
Supply Zones: $134, $149, $161
Demand Zones: $125, $113, $101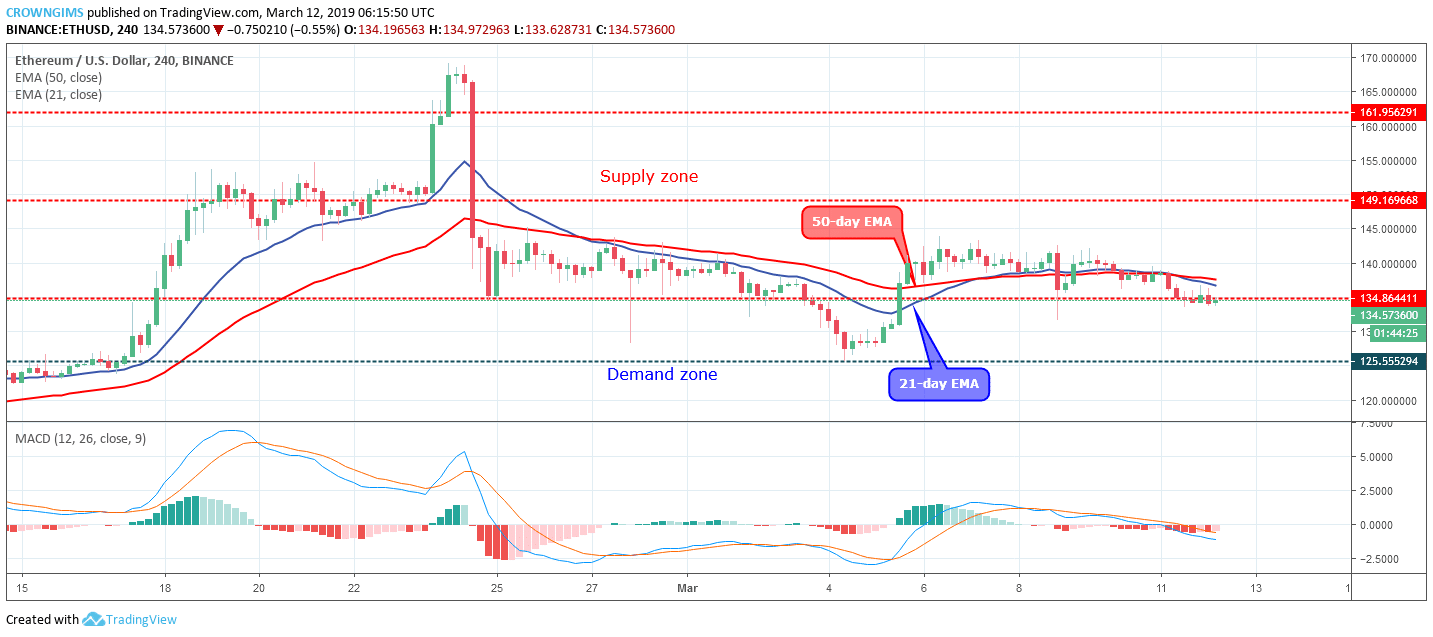

The coin has penetrated the two dynamic resistances downward and it seems that bears might break down the $134 price level. This means a good bearish momentum might drive Ethereum price down by offering a short entry to the sellers. Today the first candle seems to be a bearish candle which indicates bears’ pressure in the ETH market is increasing.
In case the ETH price goes down below the $134 price level with the bearish candle close below the level right down there, then the bears will drive Ethereum price towards the price level of $125. In case there is a rejection at $134 level, then the ranging movement may continue.
The coin is currently trading below the 21 periods EMA and 50 periods EMA while the 21 periods EMA sluggishly separating from 50 periods EMA which indicate a gradual increase in bearish momentum targeting demand zone of $125.
ETH/USD Short-term Trend: Bearish
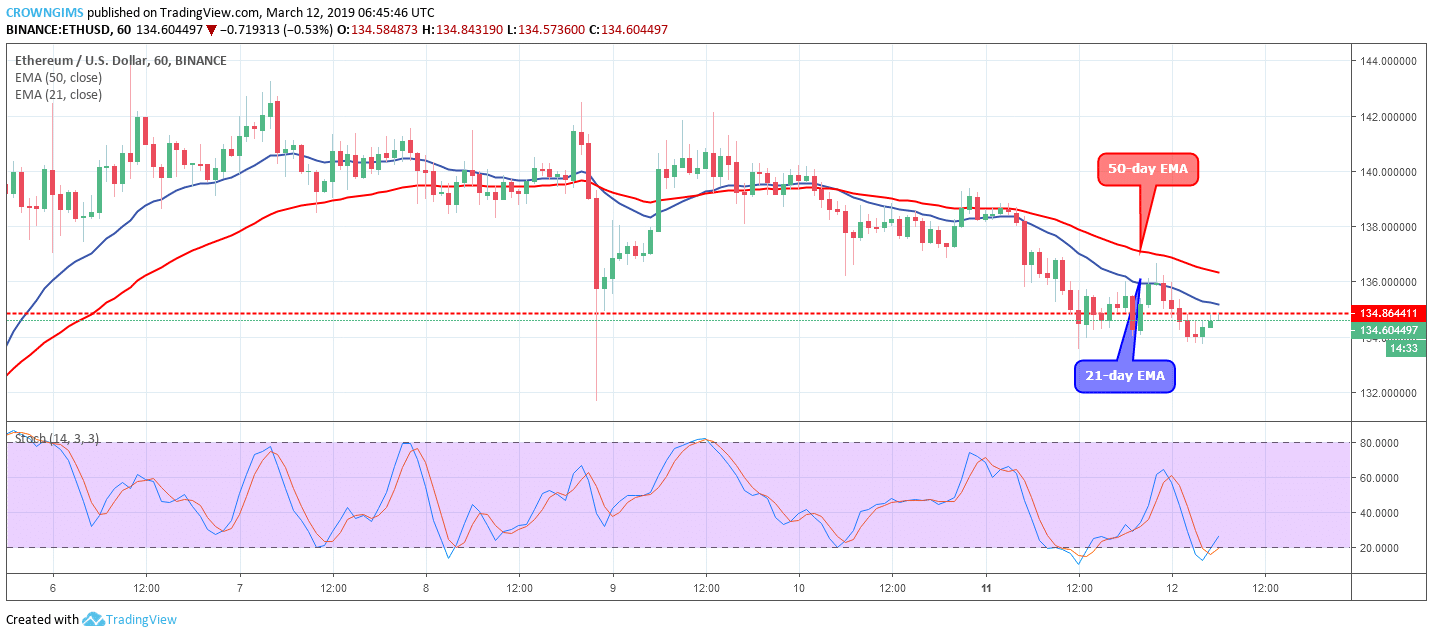
Yesterday, there was an increase in bears’ pressure which pushed the coin below the two EMAs and Ethereum price declined towards $134 price level, broke down the level and currently carrying out retest. Nevertheless, the Stochastic Oscillator period 14 is at 20 levels bending up which connotes buy signal.
next