Ethereum Price Analysis: ETH/USD Approaches Resistance at $178, Reversal May Occur

On Apr 23, 2019 at 6:45 am UTC by · 2 mins read

A bullish breakout at the supply level of $178 will make Ethereum price to reach $186. Likewise, a bearish breakout at the demand level of $168 will make the ETH price decline towards $159 price level.

Key Highlights:

  • Ethereum price may break out at $178;
  • ETH is range-bound within $178 and $168 price level;
  • the price may reverse at $178 price level.

ETH/USD Medium-term Trend: Ranging

Supply Zones: $178, $186, $194
Demand Zones: $168, $159, $150ETH is on the sideways movement on the medium-term outlook. ETH was heading towards $178 last week but lost the pressure along the way. The Bears defended the supply zone of $178 and the coin started consolidating as predicted last week. ETH/USD started this range-bound movement within $178 and $168 zones on April 18, after a strong bullish candle broke up the demand zone of $168.

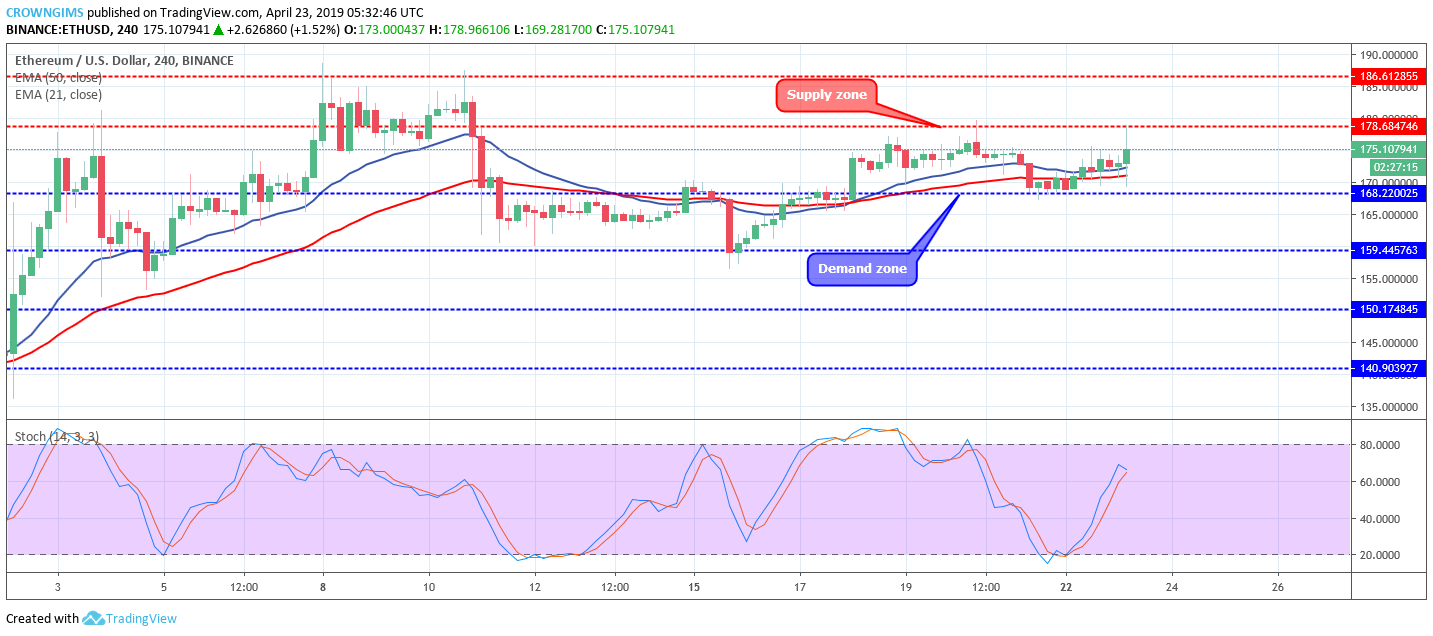
The two EMAs have come close to each other, flat horizontally within the range without showing direction. The coin is hovering over 21 periods EMA and 50 periods EMA as an indication that consolidation is ongoing in the ETH market.

Nevertheless, the Stochastic Oscillator period 14 is at 60 and the signal lines pointing up to indicate a buy signal. Certainly, a breakout is imminent; a bullish breakout at the supply level of $178 will make Ethereum price to reach $186. Likewise, a bearish breakout at the demand level of $168 will make the ETH price decline towards $159 price level.

ETH/USD Short-term Trend: Ranging

On the short-term outlook, Ethereum price is ranging. ETH price is range-bound within $178 levels and $168 price level. On the 1-hour chart, the price has touched the supply level of $178 two times and there is a possibility that Ethereum price will bounce and fall back to the demand level of $168.

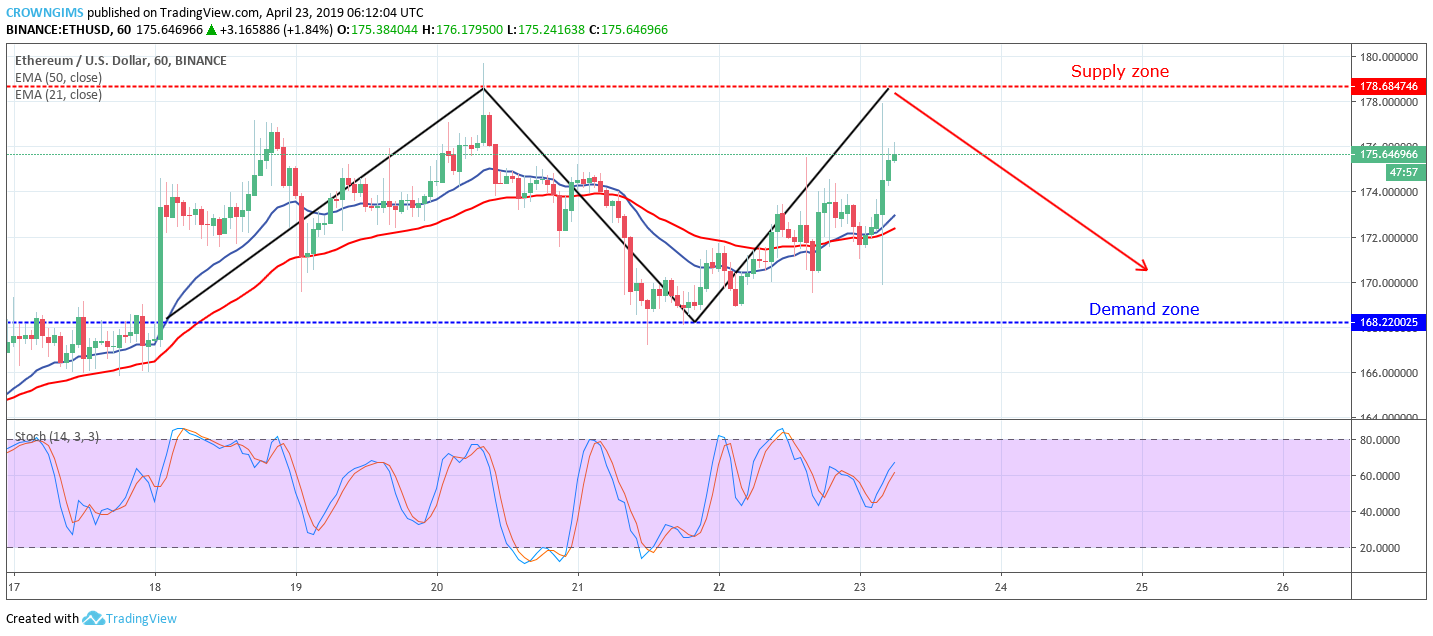
The ETH/USD is trading over, under and above the 21 periods EMA and 50 periods EMA as a sideways movement signal in the ETH market on the 1-hour chart. However, the Stochastic Oscillator period 14 is at 60 levels with the signal line bending up which connotes buy signal.

Share:

Related Articles

Whales Ditching Bitcoin for Ether, Altcoin Rally Ahead?

By August 22nd, 2025

While Bitcoin is holding on to the $113,000 level, large investors are continuously shifting to Ethereum.

ETH Rises as Singapore’s DBS Unveils Tokenized Notes on Ethereum

By August 21st, 2025

Ethereum climbed back to the $4,300 zone as the largest Singaporean bank hints at tokenized notes on the network.

Bitcoin and Ethereum ETFs See Over $1 Billion in Daily Outflow Amid “Fear” Sentiment

By August 20th, 2025

Spot Bitcoin and Ethereum ETFs recorded over $1 billion in combined outflows on August 19, marking their second-largest withdrawal day this month.

Exit mobile version