
In case the Bears were able to break down the drawn trend line, 21 periods EMA and $168 price level, then, Ethereum price will reach $159 demand zone. Otherwise, the bullish trend will continue.
Key Highlights:
- Ethereum price pulled back at $186 in the ETH market;
- the Bears interrupted the uptrend movement;
- price retracement is ongoing in the ETH market.
ETH/USD Medium-term Trend: Bullish
Supply Zones: $178, $186, $194
Demand Zones: $168, $159, $150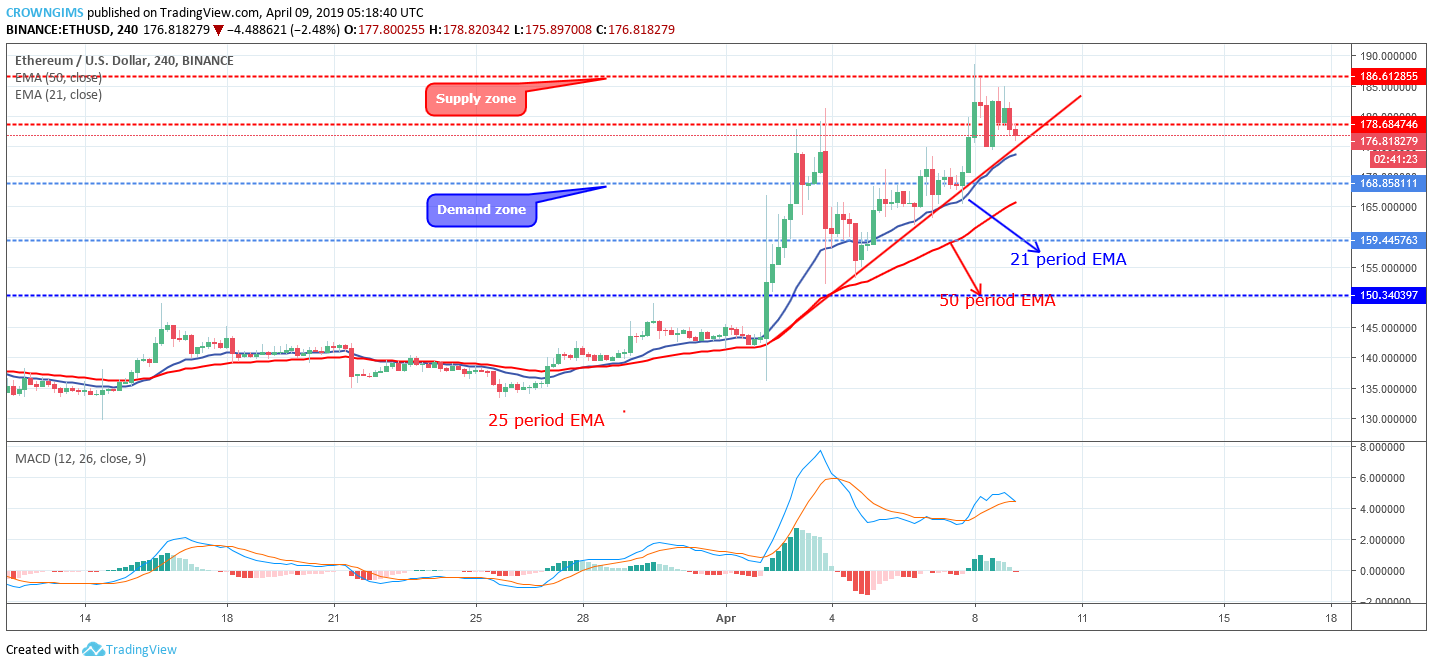

Ethereum price maintains its position above the 21 periods EMA and the 50 periods EMA and the two EMAs are pointing to the north which implies that the Bulls are still in control of the ETH market.
The histogram of Moving Average Convergence and Divergence period 12 is above zero level fading gradually to cross below zero levels and the signal lines bending down and about to cross which indicate sell signal.
In case the Bears were able to break down the drawn trend line, 21 periods EMA and $168 price level, then, Ethereum price will reach $159 demand zone. Otherwise, the bullish trend will continue.
ETH/USD Short-term Trend: Bullish
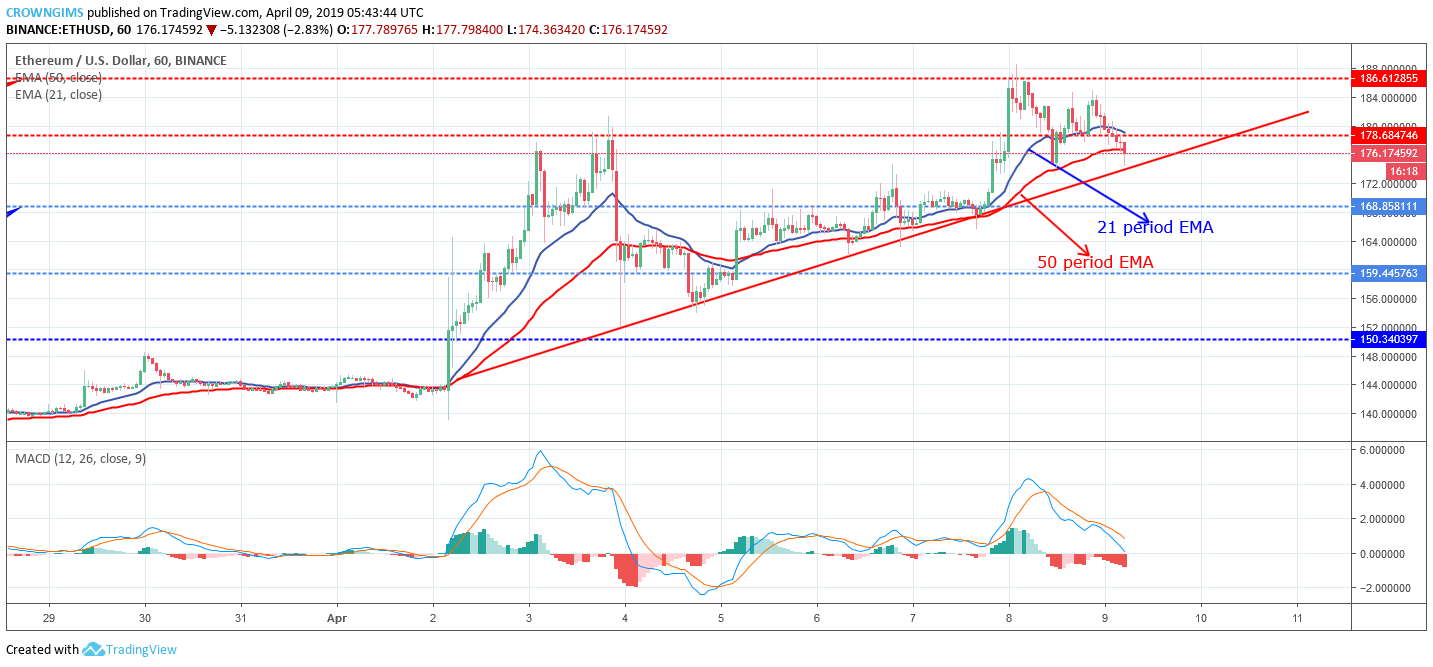
On the short-term outlook, ETH price is bullish. On April 3, the ETH touched the $178 price level. The Bears rejected the increase in the price of ETH by the formation of strong bearish candles; that pushed the coin down below $159 price level.
The price touched the drawn trend line and the Bulls took over the market. Ethereum price gradually increased with increase in the Bulls’ momentum and the price topped at $186 on April 8. The Bears interrupted the inclination of Ethereum price and the price returned downward below $178 price level.
At the moment, the coin is below the 21 periods EMA and 50 periods EMA with Bullish candle making attempt to break the trend line. Meanwhile, the MACD with its histogram is below zero levels and the signal lines pointing down to connote sell signal.
next