Ethereum Price Analysis: ETH/USD is Testing Resistance at $210

On May 14, 2019 at 10:21 am UTC by · 2 mins read

The breaking up of $210 level by the Bulls’ momentum will expose the supply level of $218. In case the Bears defend the $210 level, Ethereum price may pull back to $201 level.

Key Highlights:

  • The Bulls are in control of the ETH market;
  • Ethereum price may pull back to $201 level;
  • the coin may be exposed to $218 price level.

ETH/USD Medium-term Trend: Bullish

Supply Zones: $210, $218, $227
Demand Zones: $201, $194, $186On the medium-term outlook, ETH is on the strong bullish trend. The Bulls have not lost their momentum, the bullish candle emerged on May 11and broke up the $186 level, extended the bullish momentum to $194 level, broke it up and placed the price at $201 on May 12.

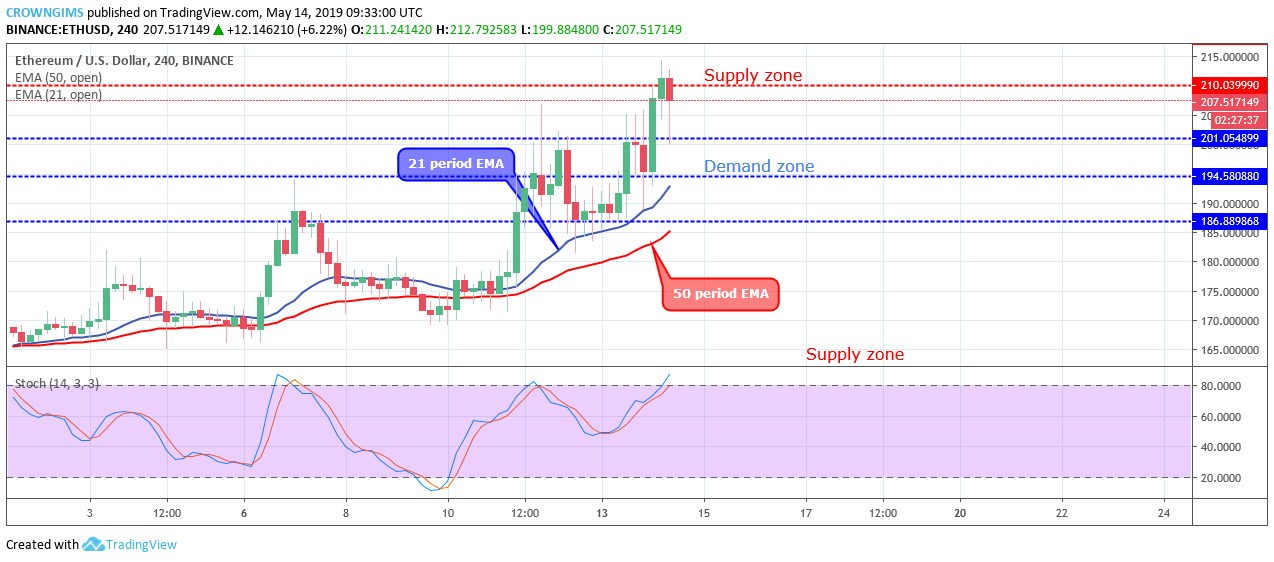
The Bears resisted further increase in Ethereum price and pushed it back to $187 level; it consolidated for a few hours at the level. The Bulls gathered momentum and pushed up the price to $210 level after passing through the barrier at $194 and $201 level.

The distance between Ethereum price and the two EMAs is increasing with the coin trading above the 21 periods EMAs and 50 periods indicates that the Bulls momentum is increasing in the Ethereum market. The Stochastic Oscillator period 14 is at the 80 levels and the signal lines pointing to the north to indicate buy signal and a further increase in Ethereum price.

The breaking up of $210 level by the Bulls’ momentum will expose the supply level of $218. In case the Bears defend the $210 level, Ethereum price may pull back to $201 level.

ETH/USD Short-term Trend: Bullish

On the short-term outlook, ETH price is Bullish. The Bulls are in full control of the Ethereum market. The price is propelling rapidly towards the north side. Consolidation took place at $186 level on May 12 – 13. The Bulls broke out the consolidation zone by the formation of bullish candles that pushed the price to $201 and later pushed it up to reach $210 level.

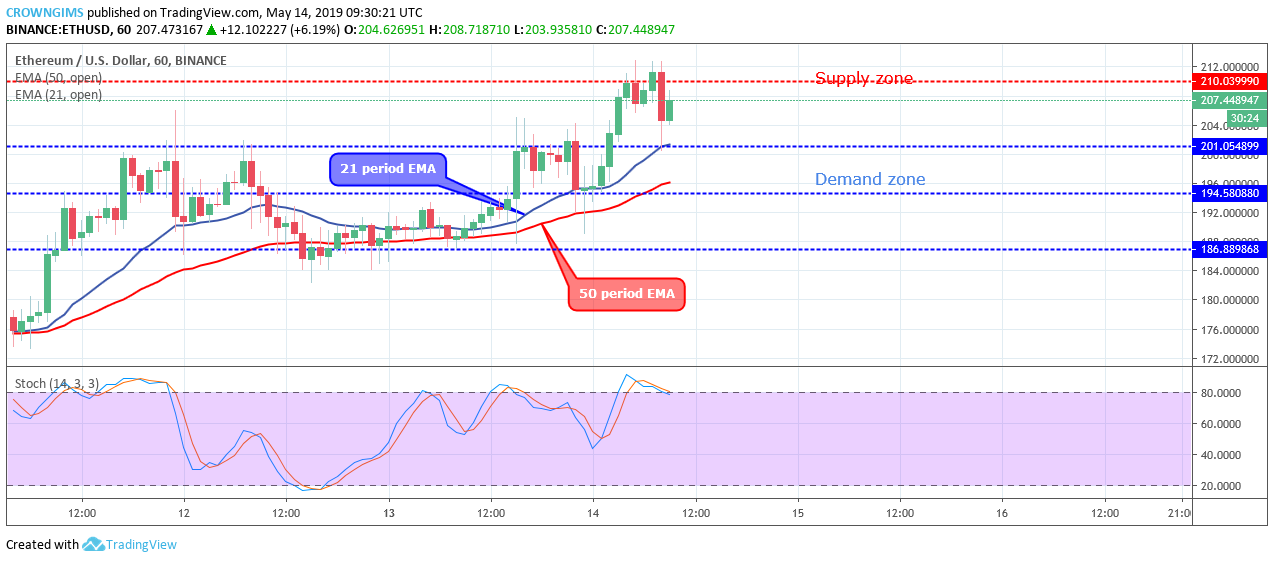
The crypto is trading above the two EMAs. The Stochastic Oscillator period 14 is above 80 levels with the signal lines point down to indicate sell signal which may be a pullback.

Share:

Related Articles

3 Reasons Bitcoin Price Failed to Cross $120K Despite Ethereum All-Time High Rally

By August 23rd, 2025

Bitcoin price missed the $120,000 breakout target while Ethereum approached all-time highs near $4,900, with market data revealing three key reasons for BTC’s underwhelming performance.

Whales Ditching Bitcoin for Ether, Altcoin Rally Ahead?

By August 22nd, 2025

While Bitcoin is holding on to the $113,000 level, large investors are continuously shifting to Ethereum.

ETH Rises as Singapore’s DBS Unveils Tokenized Notes on Ethereum

By August 21st, 2025

Ethereum climbed back to the $4,300 zone as the largest Singaporean bank hints at tokenized notes on the network.

Exit mobile version