
After the Ethereum price retest, the bullish momentum may place the price at $289 level in case the Bulls defend the $259 level.
Key Highlights:
- The Bulls have taken over the Ethereum market;
- Ethereum price is currently within the ascending channel;
- the price is experiencing a pullback.
ETH/USD Medium-term Trend: Bearish
Supply Zones: $258, $289, $318
Demand Zones: $225, $191, $102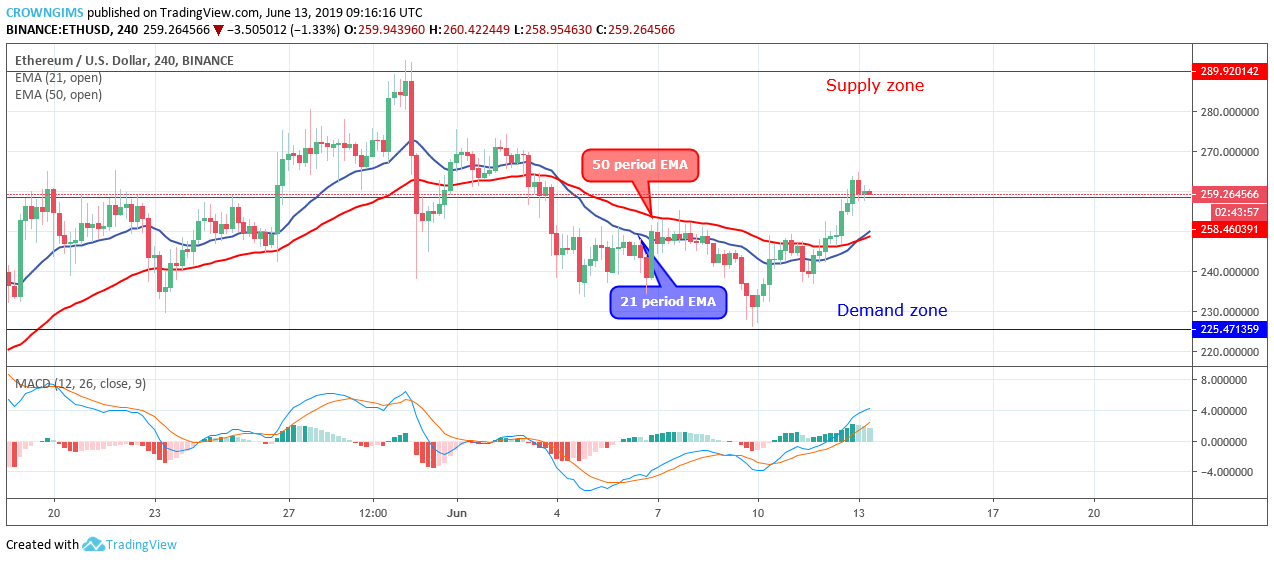

The bullish momentum propelled Ethereum price to break up the two dynamic support and resistance level and the bullish momentum extended to the supply zone of $258. The mentioned level was penetrated and the bullish candle closed above the level; it indicates that the rise in the price of Ethereum may continue.
Currently, ETH price is carrying out a pullback at $259 before the bullish trend continues. The 21 periods EMA is crossing over the 50 periods EMA, Ethereum price is trading above the two EMAs as a bullish sign. After the price retest, the bullish momentum may place the price at $289 level in case the Bulls defend the $259 level.
The histogram of the Moving Average Convergence Divergence period 12 is above the zero levels with the signal lines pointing upside which implies a continuation of the price increase.
ETH/USD Short-term Trend: Bullish
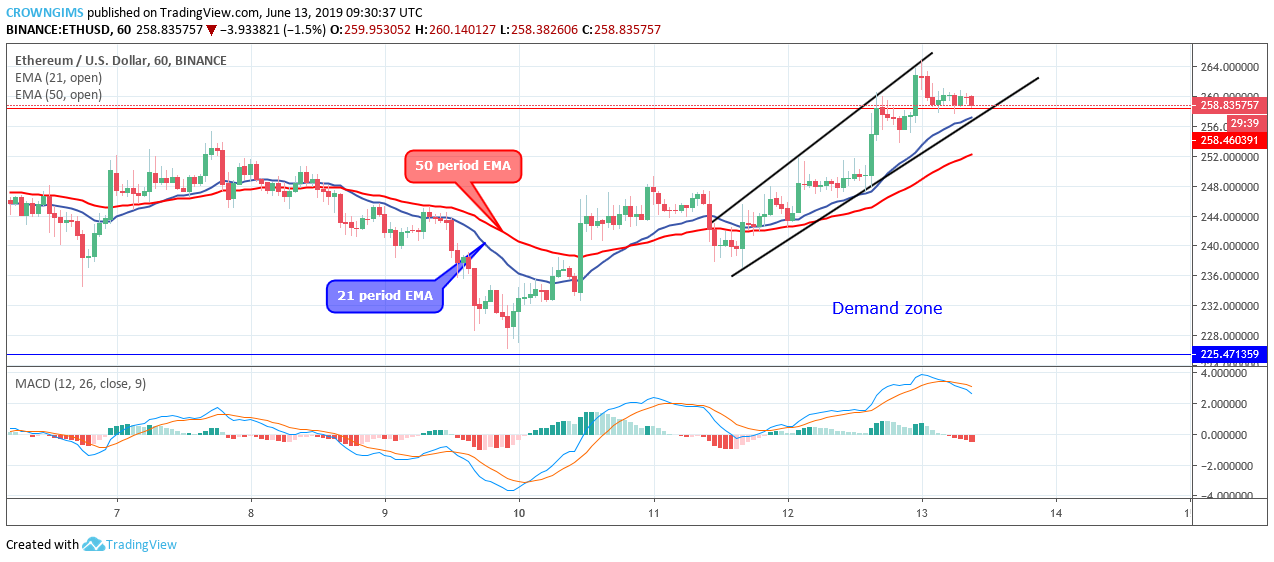
On the 1-hour chart, the 21 periods EMA and 50 periods EMA are bending up with the Ethereum price trading above the two EMA. The Moving Average Convergence Divergence period 12 with its histogram is below the zero levels and the signal lines are bending down to indicate sell signal which may be a pullback.
next