Ethereum Price Analysis: ETH/USD Hits $275, Enters Potential Reversal Zone

On May 28, 2019 at 8:21 am UTC by · 2 min read

Further increase in the Ethereum price towards $287 level is possible only when the Bulls gain more momentum and the supply level of $275 is penetrated. In case the $275 level holds, the price may decrease towards $258 level.

Key Highlights:

  • Ethereum price broke out the ranging zone at $258 level;
  • the Bulls prevailed;
  • Ethereum price rallied towards $275 level.

ETH/USD Medium-term Trend: Bullish

Supply Zones: $275, $287, $300
Demand Zones: $258, $242, $227Ethereum is bullish on the medium-term outlook. The crypto was range-bound last week within the demand zone of $242 and the supply zone of $258. On May 26, the Bulls gained momentum that is enough to break the barrier at $258 level; this is confirmed with the formation of a strong bullish candle that penetrated the $258 level upside. More bullish candles followed and the price increased towards the supply level of $275. It seems that the bullish momentum is a bit weak; consolidation is ongoing around the level.

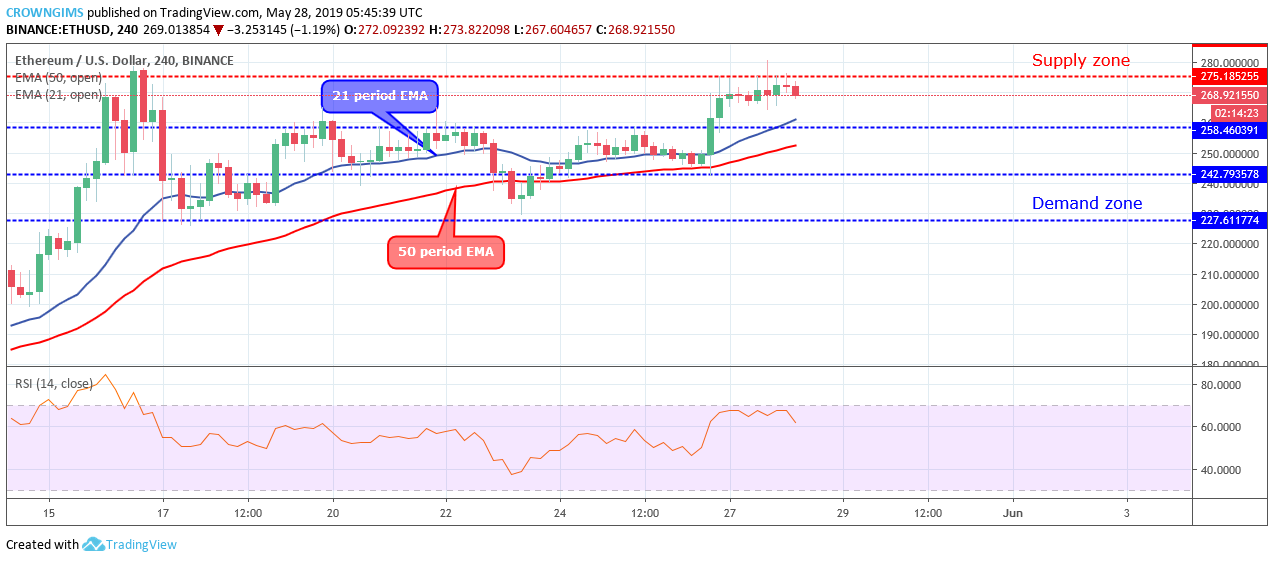
Ethereum price is currently trading above the 21 periods EMA and 50 periods EMA. The two EMAs are well separated which indicates increased bullish momentum. Further increase in the price towards $287 level is possible only when the Bulls gain more momentum and the supply level of $275 is penetrated. In case the $275 level holds, the price may decrease towards $258 level. The Relative Strength Index period 14 is above 60 levels with the signal line bending down which connotes sell signal.

ETH/USD Short-term Trend: Bullish

ETH price is bullish on the short-term outlook. The Bulls were able to take the Ethereum price to the next level above $258 after the ranging movement within the $242 and $258 levels. Ethereum price reached $275 level and the coin started consolidating around the zone.

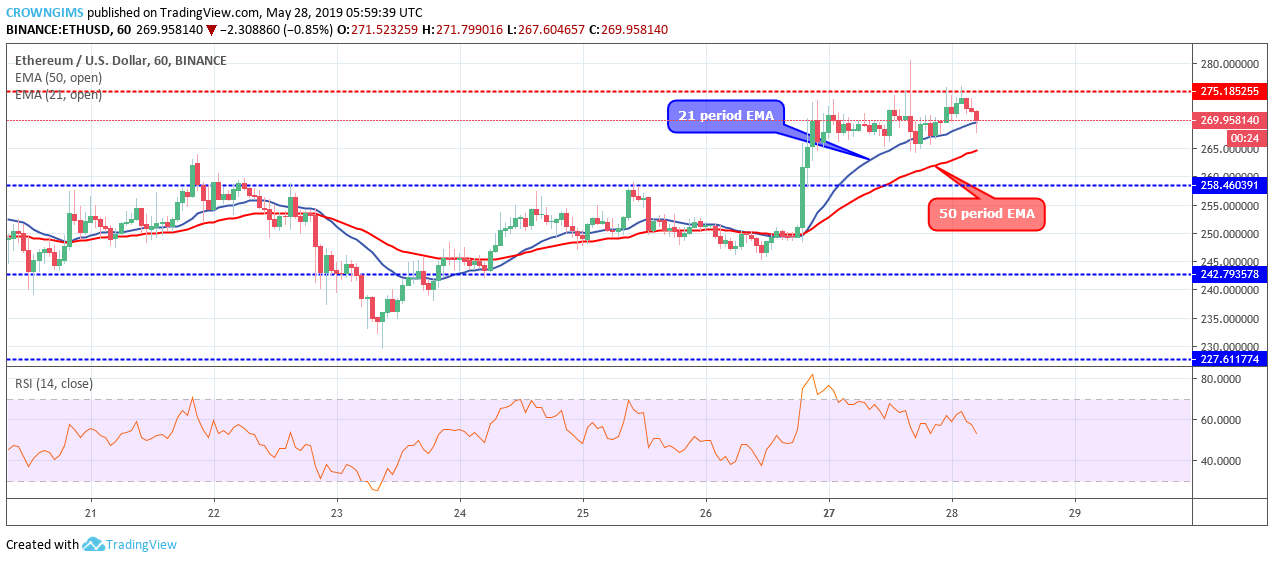
The coin is directly trading on the 21 period EMA; which indicates weak momentum, the 50 periods is at a distance below the 21 periods EMA. Meanwhile, the Relative Strength Index period 14, is at 50 levels with the signal line pointing down to indicate a sell signal.

Share:

Related Articles

Ethereum Gas Fees Plummet to Three-Year Low While ETH Price Action Remains Unmoved

By April 29th, 2024

Santiment revealed that the average fee for transactions on the ETH network has been reduced to $1.12 per transaction

Bitcoin Price Drops Below $63K as Ether Gains Signaling Altseason Ahead

By April 29th, 2024

The trading of spot Bitcoin ETFs in Hong Kong, which begins tomorrow, will further strengthen the long-term bullish sentiment.

Here Are 3 Major Recent Cardano (ADA) Upgrades to Know

By April 26th, 2024

Cardano’s robust smart contracts and ample data storage capacity provide an efficient supply chain tracking solution, enhancement, visibility, transparency, and accountability.

Exit mobile version