Ethereum Price Analysis: ETH/USD Surpassed $289, Preparing to Break $318 Level

Updated on Jun 25, 2019 at 7:55 am UTC by · 2 mins read

Ethereum price has carried out a pullback and ready for the bullish movement continuation. Ability to break up the barrier at $318 level will expose the coin to the $351 supply level.

Key Highlights:

  • The Bulls broke out at $277 level;
  • Ethereum price surpassed $289 level;
  • the Bulls are fully in control of the Ethereum market.

ETH/USD Medium-term Trend: Ranging

Supply Zones: $318, $351, $375
Demand Zones: $289, $277, $258On the medium-term outlook, Ethereum is bullish. The Bulls prevailed over the Bears. The coin was range-bound within the demand zone of $258 and the supply zone of $277 last week due to low Bulls’ momentum and the Bears’ momentum. On June 21, there was a bullish engulfing candle that emerged and broke up the former supply level of $289. The bullish pressure pushed up the coin to reach the supply level of $318.

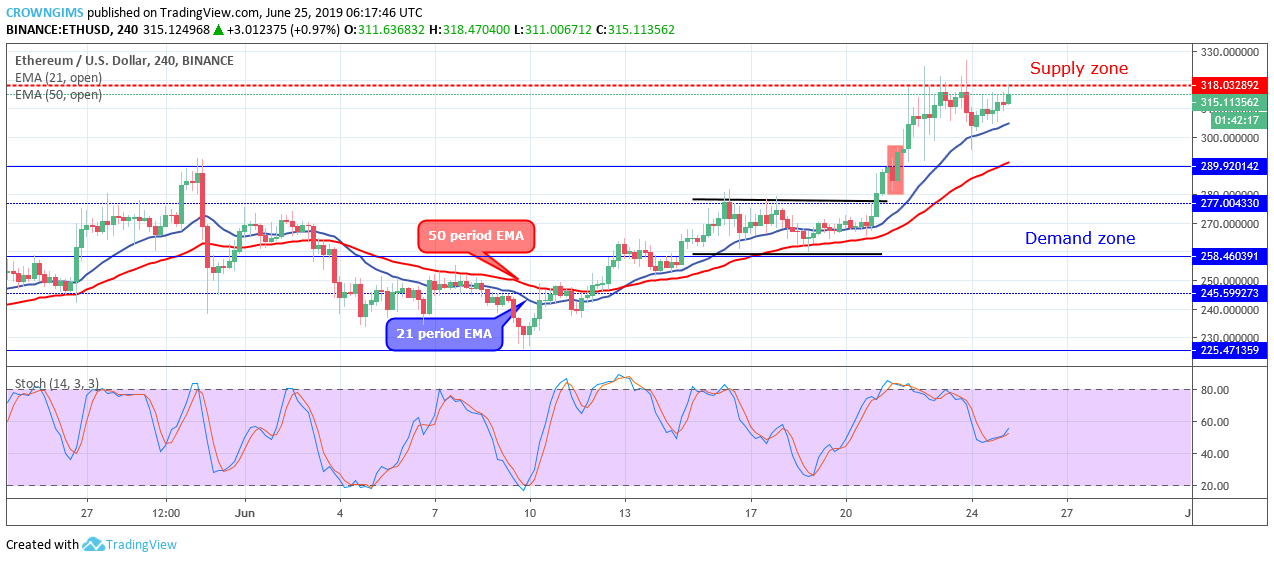
Ethereum price is trading above the 21 periods EMA and 50 periods EMA at a distance to each other which indicates strong bullish pressure. The Stochastic Oscillator period 14 is above 40 levels with the signal lines bending up to indicate a buy signal. Ethereum price has carried out a pullback and ready for the bullish movement continuation. Ability to break up the barrier at $318 level will expose the coin to the $351 supply level.

ETH/USD Short-term Trend: Bullish

ETH price is bullish on the short-term outlook. Ethereum broke out at the $277 price level after the consolidation. The Bulls propelled the coin towards the $289 level and broke it up. The bullish momentum extended to $318 supply level. The Bullish pressure began to show signs of weakness by moving sideways at the level.

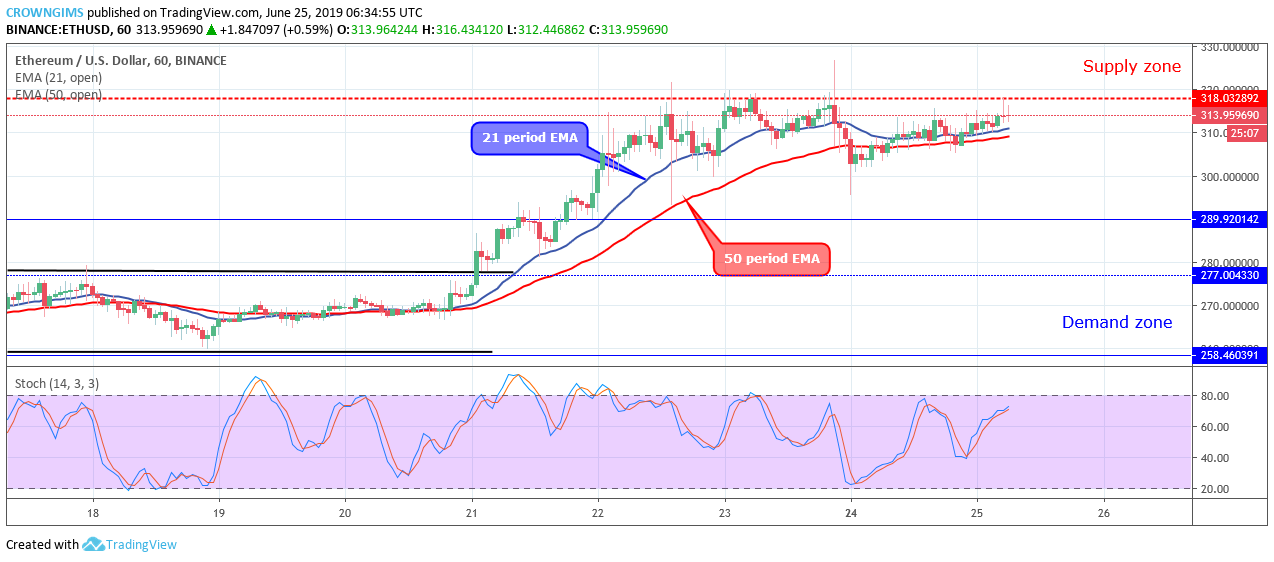
As at the moment, the coin is moving sideways at $318 level. The crypto is trading over and around 21 periods EMA and 50 periods EMA with the two EMAs close to each other which confirms the ongoing consolidation in the Ethereum market. Nevertheless, the Stochastic Oscillator period 14 is above 75 levels and the signal lines pointing up to indicate a buy signal.

Share:

Related Articles

ETH Price Shows Signs of Reversal Despite Ethereum ETF Outflows

By December 12th, 2025

ETH has begun to reverse from its post-FOMC decline, rebounding to $3,250, despite the Ether ETF flow turning negative for the first time this week.

XRP ETF Outperforms BTC, SOL, ETH, but XRP Price in a Make-Or-Break Situation

By December 9th, 2025

Spot XRP ETFs saw $38M inflows, outperforming BTC, ETH, and SOL. XRP price tests key $2.04 support, with potential downside toward $1.64-$1.73.

Ethereum Price Prediction: ETH Traders Quietly Lost Millions in ‘Sandwich Attacks’ – New Signal Hints at a Safer, More Bullish ETH

By December 5th, 2025

A new study has revealed that Ethereum traders lost millions to sandwich attacks over the past year, quietly draining value from everyday users and favoring stealthy exploiters.

Exit mobile version