
The breakout of Ethereum price from the triangle is imminent. Should the Bears exert more pressure, there will be a breakout at the $242 demand level with ETH targeting $227 level. In case the $242 level holds, there may be a breakout at $258 level.
Key Highlights:
- Sideways movement is ongoing in the Ethereum price;
- there may be a breakout at $242 level;
- breakout is imminent.
ETH/USD Medium-term Trend: Ranging
Supply Zones: $258, $275, $287
Demand Zones: $242, $227, $206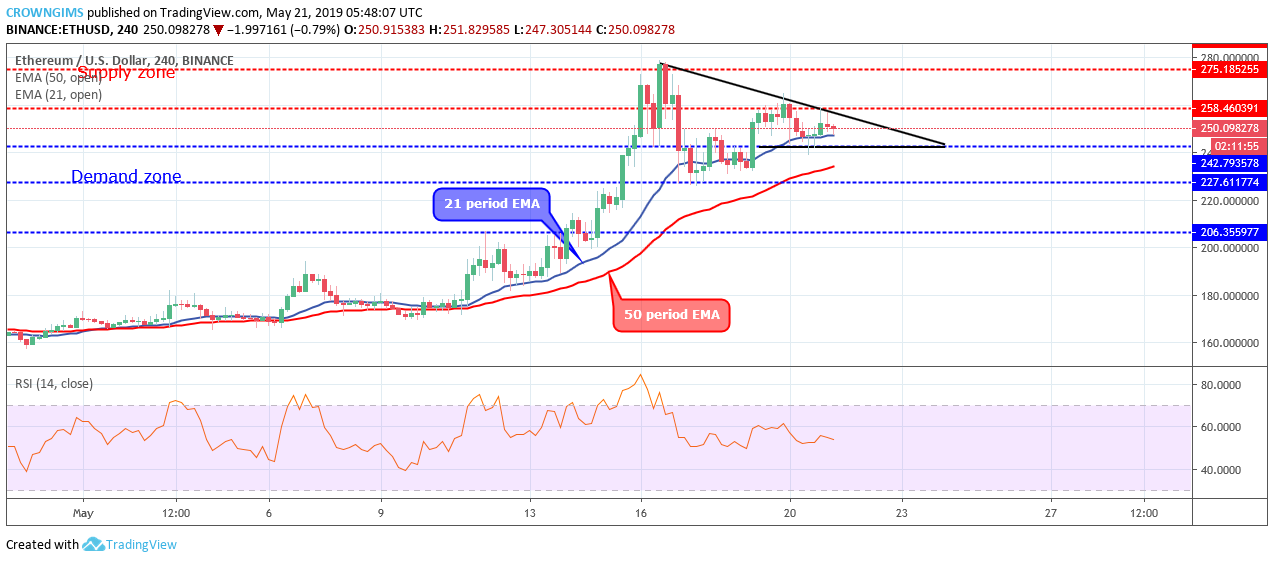

On May 19, a strong bullish candle emerged that broke up the $242 level and the price moved towards the supply zone of $258 level. At that point, the Bulls lost their momentum again and the Bears’ momentum is weak as well, the price resulted to consolidation within $242 and $258 level.
Ethereum price has formed a descending triangle pattern and the price is trading directly on the 21 periods EMAs and 50 periods. The Relative strength Index period 14 is at 50 levels and the signal lines pointing down to indicate sell signal. The breakout of the price from the triangle is imminent. Should the Bears exert more pressure on Ethereum price, there will be a breakout at the $242 demand level and may target $227 level. In case the $242 level holds, there may be a breakout at $258 level.
ETH/USD Short-term Trend: Ranging
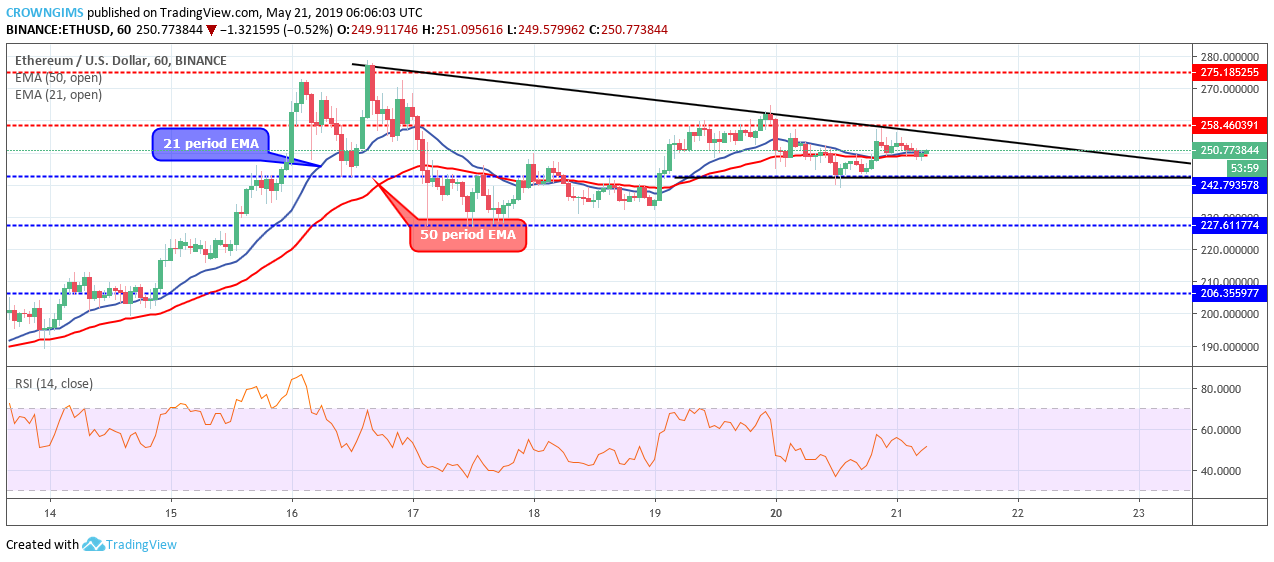
Ethereum price is hovering over the 21 periods EMA and 50 periods EMA within the triangle. The Relative Strength Index period 14, is at 50 levels with the signal line pointing up to indicate a buy signal.
next