Ethereum Price Analysis: ETH/USD Price Approaches Potential Reversal Zone of $289

On May 30, 2019 at 11:02 am UTC by · 2 mins read

It seems that the Bulls are gathering momentum to break up Ethereum’s supply zone at $289. Should the Bears further defend the $289 supply level, Ethereum price may continue the sideways movement within the range.

Key Highlights:

  • Ethereum price is consolidating at $258 – $289 levels;
  • the Bulls are prevailing;
  • Ethereum price has touched the $289 supply level.

ETH/USD Medium-term Trend: Bullish

Supply Zones: $289, $287, $351
Demand Zones: $258, $318, $191On the medium-term outlook, Ethereum is bullish. After several hours of consolidation within $225 demand level and $258 supply level, the Bulls broke up at the $258 levels on May 26. The second phase of consolidation started on May 27, and the Bulls’ momentum is at equilibrium with the Bears’ momentum at the range of $258 and $289 level. At the opening of today’s market, a big bullish candle emerged that pushed Ethereum price up to touch the supply level of $289.

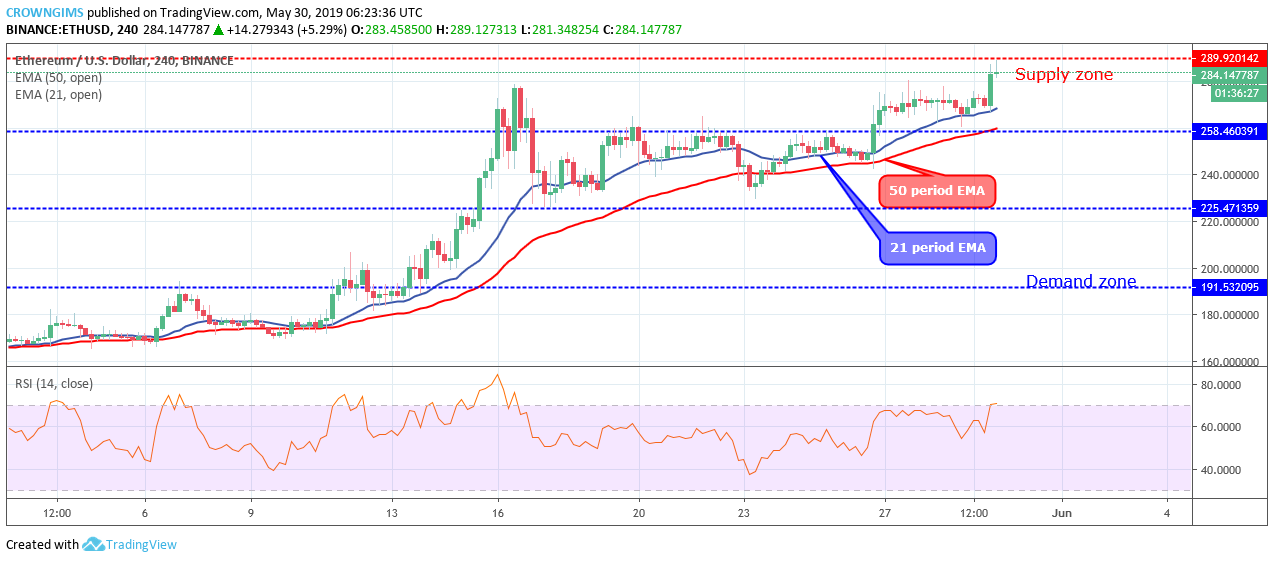
It seems that the Bulls are gathering momentum to break up the supply zone at $289 in case the level does not hold. Should the Bears further defend the $289 supply level, Ethereum price may continue the sideways movement within the range.

However, Ethereum is trading above the 21 periods EMA and 50 periods EMA, the two EMAs are bending towards the direction of the trend with an increase in the distance between the two; this is a confirmation of the Bulls increased momentum. The Relative Strength Index period 14 is above 70 levels with the signal line bending down to indicate sell signal which may be sell signal.

ETH/USD Short-term Trend: Bullish

On the short-term outlook, ETH price is bullish. On the 1-hour chart, the Bulls were unable to push the Ethereum price to the $289 supply level after it crossed the barrier at $258 level. The Bulls’ and the bears’ momentum were weak. Today, the Bulls gained momentum and Ethereum price was pushed up to touch the $289 level. It is currently pulling back as a sign of respect for the resistance level.

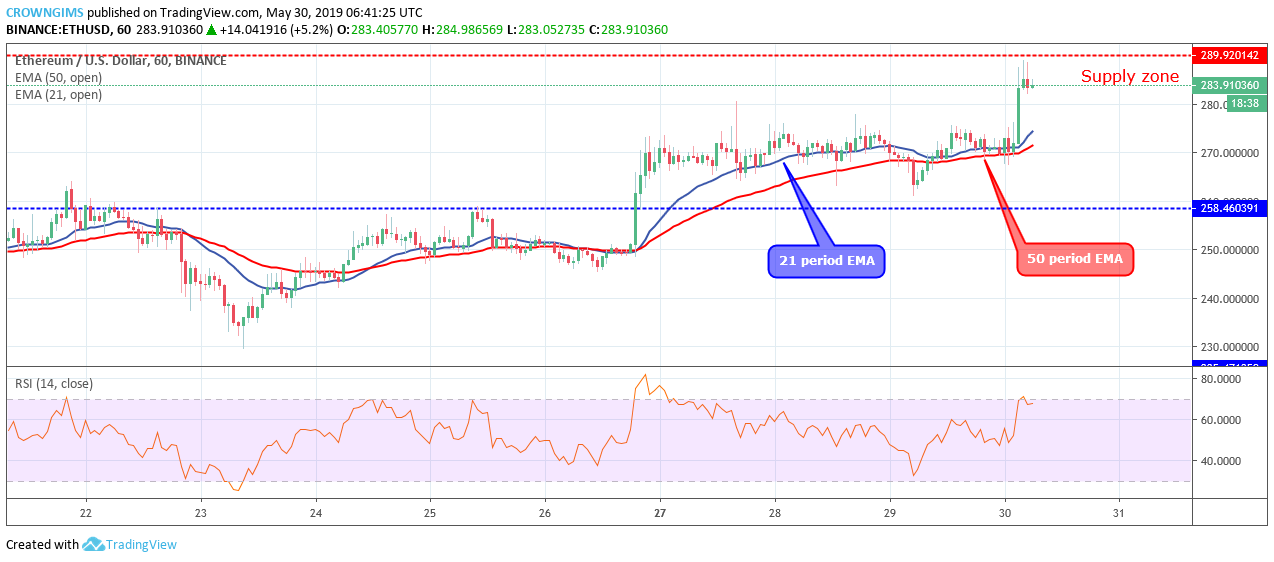
The coin is trading above the 21 periods EMA and 50 periods EMA; which indicates bullish momentum, The Relative Strength Index period 14, is at 70 levels with the signal line pointing down to indicate a sell signal, it may be a pullback.

Share:

Related Articles

3 Reasons Bitcoin Price Failed to Cross $120K Despite Ethereum All-Time High Rally

By August 23rd, 2025

Bitcoin price missed the $120,000 breakout target while Ethereum approached all-time highs near $4,900, with market data revealing three key reasons for BTC’s underwhelming performance.

Whales Ditching Bitcoin for Ether, Altcoin Rally Ahead?

By August 22nd, 2025

While Bitcoin is holding on to the $113,000 level, large investors are continuously shifting to Ethereum.

ETH Rises as Singapore’s DBS Unveils Tokenized Notes on Ethereum

By August 21st, 2025

Ethereum climbed back to the $4,300 zone as the largest Singaporean bank hints at tokenized notes on the network.

Exit mobile version