Ethereum Price Analysis: ETH/USD May Break Down $242 Level and Target $227

On May 23, 2019 at 7:57 am UTC by · 2 mins read

Ethereum price is directly on the demand level of $242, should the Bulls exert pressure to break down the level and the 4-hour candle closes below the level, $227 demand level may be the target.

Key Highlights:

  • Ethereum price is ranging within $242 and $258;
  • there may be a breakout at $242 level;
  • the Bears may prevail.

ETH/USD Medium-term Trend: Ranging

Supply Zones: $258, $275, $287
Demand Zones: $242, $227, $206Ethereum continues sideways movement on the medium-term outlook. There was no significant movement in the Ethereum market for three days. On May 21, the Bulls tried to break up the supply zone of $258 but were resisted by the Bears. Yesterday, a bearish candle emerged to break down the demand zone of $242; it was prevented by the Bears. Ethereum price remains range-bound within the demand zone of $242 and the supply zone of $258. Radical fundamental events may be required to make the coin rally.

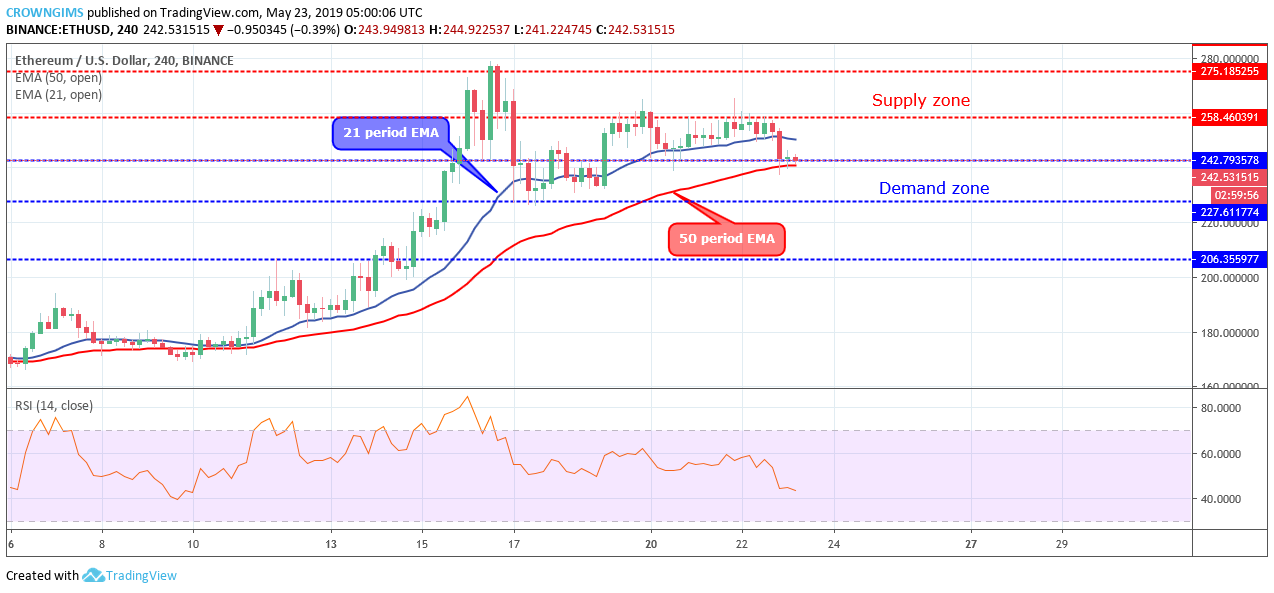
ETH price is directly on the demand level of $242, should the Bulls exert pressure to break down the level and the 4-hour candle closes below the level, $227 demand level may be the target. In case the Bulls defend the demand level of $242 again, consolidation may continue within the range.

However, the crypto is found trading in between the 21 periods EMA and 50 periods EMA and the Relative Strength Index period 14 is at 40 levels with the signal lines bend down to indicates sell signal.

ETH/USD Short-term Trend: Bearish

ETH price is bearish on the short-term outlook. Last week, Ethereum was on the ranging mode on the 1-hour chart. The pressure of the Bears was increased and Ethereum price decreased, the coin is currently breaking the barrier at $242, in case the current candle closes below the level, then $227 demand level may be reached. The two EMAs have penetrated downside and the coin trading below the 21 periods EMA and 50 periods EMA.

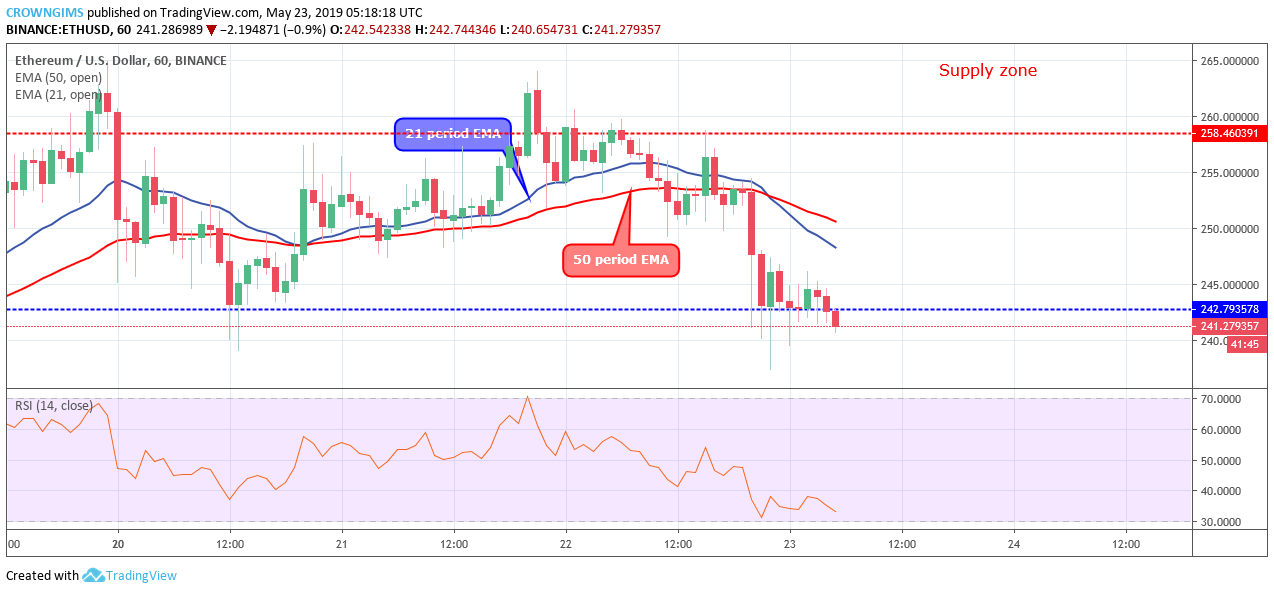
The 21 periods EMA has crossed the 50 periods EMA as a bearish momentum sign. The Relative Strength Index period 14, is above 30 levels with the signal line pointing down to indicate a sell signal.

Share:

Related Articles

WisdomTree Posts $764M Crypto Inflows as Q3 AUM Hits Record $137.2B

By October 31st, 2025

WisdomTree’s cryptocurrency products attracted $764 million in Q3 net inflows, accounting for 34% of total inflows as AUM reached a record high.

ETH Price on Verge of Breaking Down at $3,800 as Ethereum ETF Outflows Surge

By October 31st, 2025

ETH price has dropped 3% to around $3,800, a critical support level, as bearish momentum intensifies amid rising outflows from spot Ethereum ETFs.

Ether.Fi Joins Token Buyback Frenzy: Community Proposes $50M Allocation

By October 31st, 2025

ether.fi’s community has introduced a proposal to allocate $50 million toward ETHFI token buybacks below $3.

Exit mobile version