
In case the Bulls were able to break up the supply zone of $275, Ethereum price will be exposed to $287 level. Should the Bears defend the $275 level, the price may pull back to $258 – $242 level.
Key Highlights:
- The Bulls maintain their momentum in the Ethereum market;
- Ethereum price may increase to $287 level;
- price retracement is inevitable.
ETH/USD Medium-term Trend: Bullish
Supply Zones: $275, $287, $299
Demand Zones: $258, $242, $227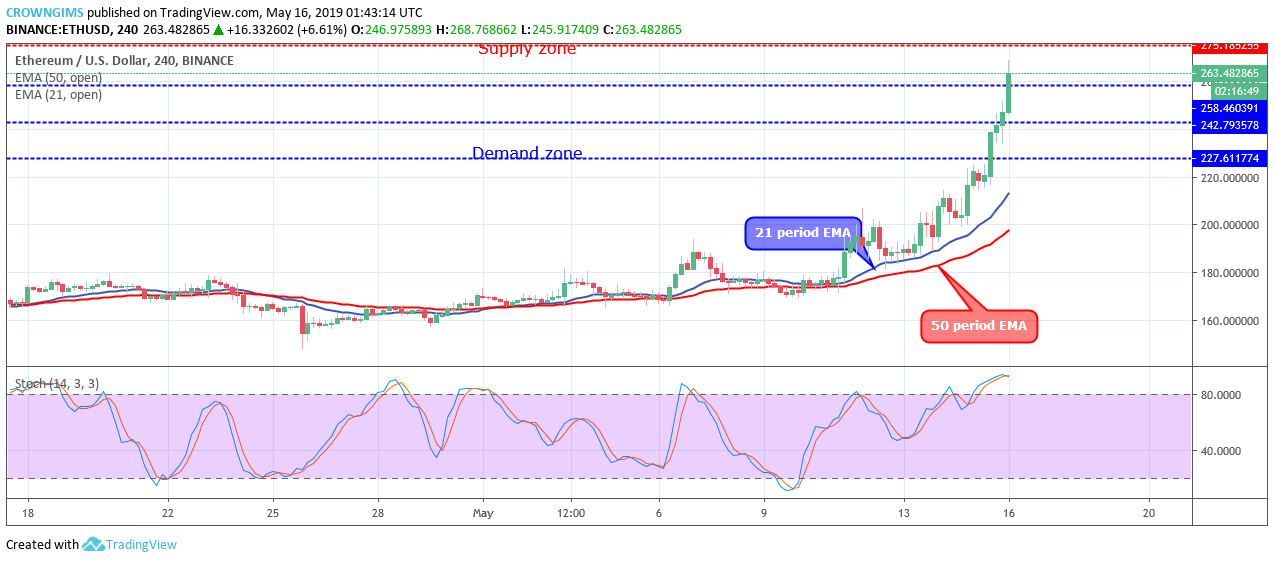

The coins do observe the pullback after a certain level of the uptrend but on May 15, the bullish trend has been consistency without price retest. The bullish trend has penetrated the $227, $242, $and 4258 levels and currently facing $275 price level.
The coin remains trading above the 21 periods EMAs and 50 periods with an increase in the distance between Ethereum price and the two EMAs which indicates that the Bulls momentum is increasing in the Ethereum market. The Stochastic Oscillator period 14 is above 80 levels and the signal lines pointing down to indicate sell signal which may be a pullback.
In case the Bulls were able to break up the supply zone of $275, Ethereum price will be exposed to $287 level. Should the Bears defend the $275 level, the price may pull back to $258 – $242 level.
ETH/USD Short-term Trend: Bullish
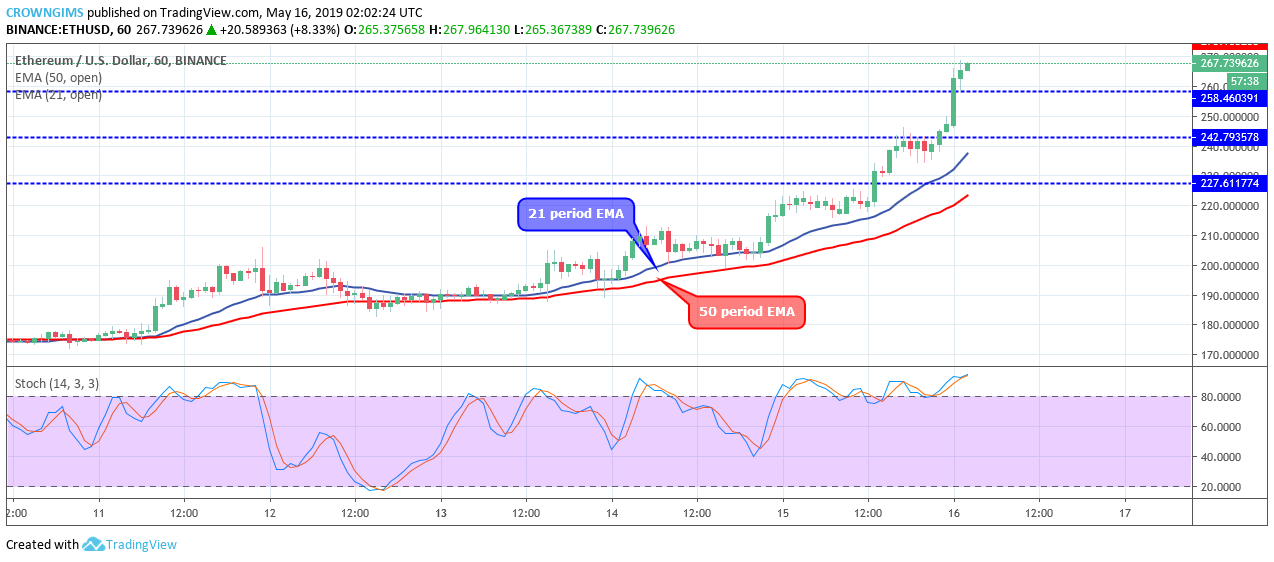
Ethereum market closed yesterday with a bullish candle and opened today’s market with a strong bullish candle on 1-hour chart; this is to indicate that bullish trend may likely continue.
The crypto is trading above the two EMAs. The Stochastic Oscillator period 14 is above 80 levels with the signal lines point down to indicate sell signal which may be a pullback.
next