Ethereum Price Analysis: ETH/USD Trends of February 12–18, 2019

Updated on Apr 28, 2022 at 11:17 am UTC by · 2 mins read

Continuation of bullish trend is guaranteed as long as the bulls maintain or increase their pressure; otherwise, in case the bears reject a further increase in Ethereum price, the coin will found its support at $101 price level.

Key Highlights:

  • The Bulls have taken over the Ethereum market;
  • the Bears lose momentum after the consolidations;
  • ETH price resumed uptrend movement.

ETH/USD Long-term Trend: Bullish

Supply levels: $134, $149, $163
Demand levels: $114, $101, $85ETH/USD changed to an uptrend on the long-term outlook. The crypto was consolidating since January 28 – February 07 within the price range of $101 and $114. The morning Doji star candle pattern was formed at the demand level of $101 as an indication that the bulls were ready to take over the ETH market. Then, the bullish momentum pushed up Ethereum price and broke up $114 price level on February 8. The coin is currently facing the supply level of $134 observing a pullback.

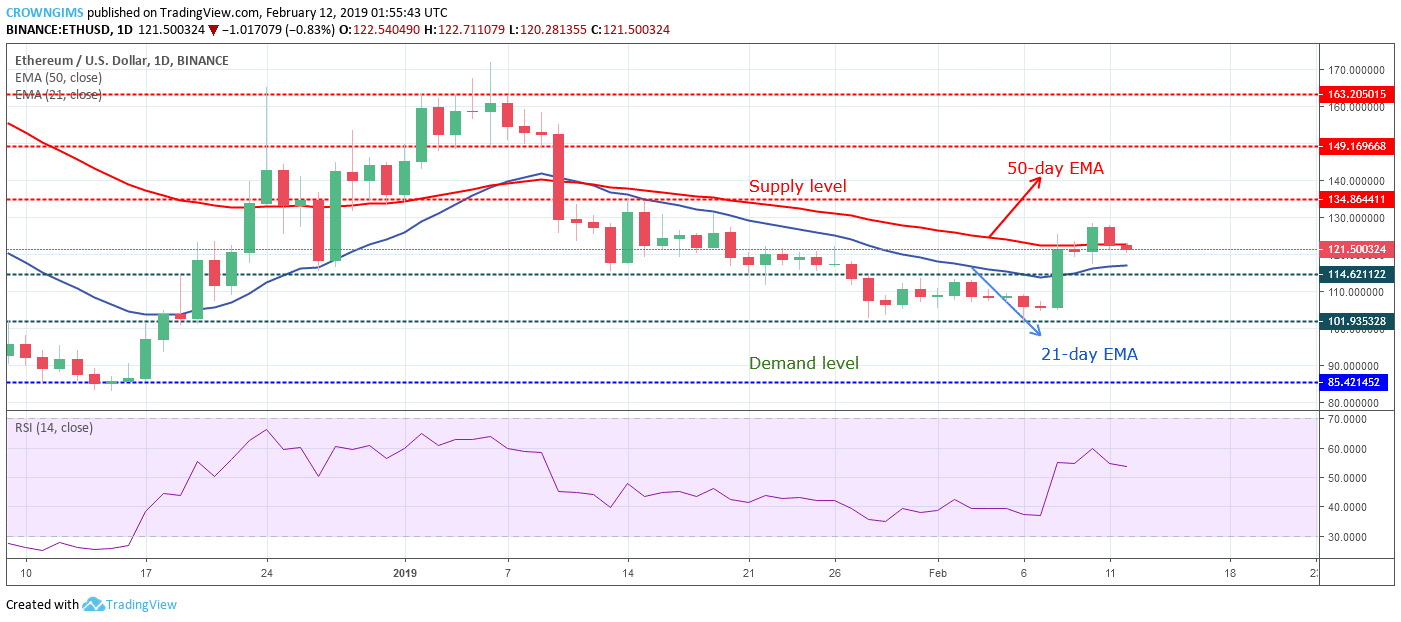
The 21-day EMA has not crossed the 50-day EMA upside but rather making attempt to cross over in which Ethereum price is trading above the two EMAs which confirm the uptrend. The relative strength index period 14 is at 52 levels and its signal line pointing down which indicate sell signal. Continuation of bullish trend is guaranteed as long as the bulls maintain or increase their pressure, otherwise, in case the bears reject a further increase in ETH price, the coin will found its support at $101 price level.

ETH/USD Medium-term Trend: Bullish

Ethereum price is on the bullish trend on the 4-Hour chart. The Bulls took over the ETH market last week. Increase in bullish momentum made the ETH/USD breakout of the ranging zone. The massive strong bullish candle broke up the $114 price level and the coin was topped above the $128 price level. The bears rejected the increase in the price of ETH.

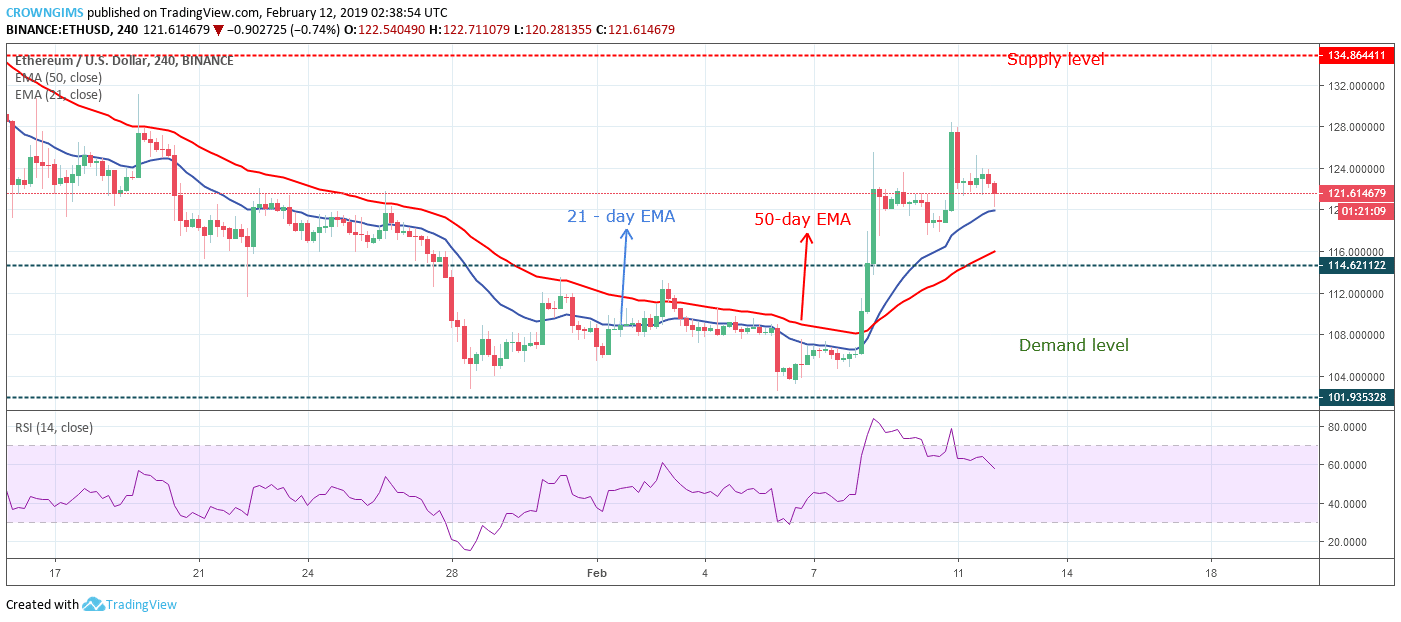
The 21-day EMA has already crossed the 50-day EMA upside confirming the change of trend to bullish and ETH price is above the two EMAs making higher highs movement. The relative strength index period 14 is below 60 levels and its signal line pointing down indicates sell signal which may be a pullback.

Share:

Related Articles

SharpLink to Deploy $200M ETH on Linea via ether.fi, EigenCloud

By October 28th, 2025

SharpLink Gaming allocates $200 million in Ethereum to Linea’s zkEVM Layer 2, combining staking and restaking services to generate enhanced institutional yields.

Ethereum Shows ‘Strong Bounceback’ Amid Massive Fund Holdings Growth, $4,300 Next?

By October 28th, 2025

While ETH and BTC continue to attract long-term investors, the pace of capital inflows has shifted in Ethereum’s favor over the past year.

MegaETH Layer-2 ICO Oversubscribed Within Minutes, Attracts $360M in Commitments

By October 27th, 2025

MegaETH’s initial coin offering became oversubscribed within five minutes on October 27, attracting $360.8 million in commitments. Final allocations will be determined by assessing participants’ community engagement through social and on-chain metrics.

Exit mobile version