Ethereum Price Analysis: ETH/USD Trends of February 19–25, 2019

Updated on Apr 28, 2022 at 11:18 am UTC by · 2 mins read

In case the previous high of $161 price level is breached by the bulls, Ethereum price may have its target at $194 supply zone. On the other hand, should the bears defend the $161 price level; ETH price will fall towards $134 – $117 price level.

Key Highlights:

  • The Bulls are still in control of the Ethereum market;
  • the Bears may take over in case the $161 price level is defended;
  • the price level of $161 may be breached.

ETH/USD Long-term Trend: Bullish

Supply Zones: $134, $161, $194
Demand Zones: $117, $101, $82ETH/USD is bullish on the long-term outlook. The Bulls maintained their momentum last week as predicted and it enables Ethereum price to move higher to the next level than that of last week. The crypto was consolidating on the top of 50-day EMA last week as the 21-day EMA was making an attempt to cross 50-day EMA upside, later; on February 17 the bulls increased their pressure with the formation of strong bullish candles that pushed the ETH price towards $161 demand zone.

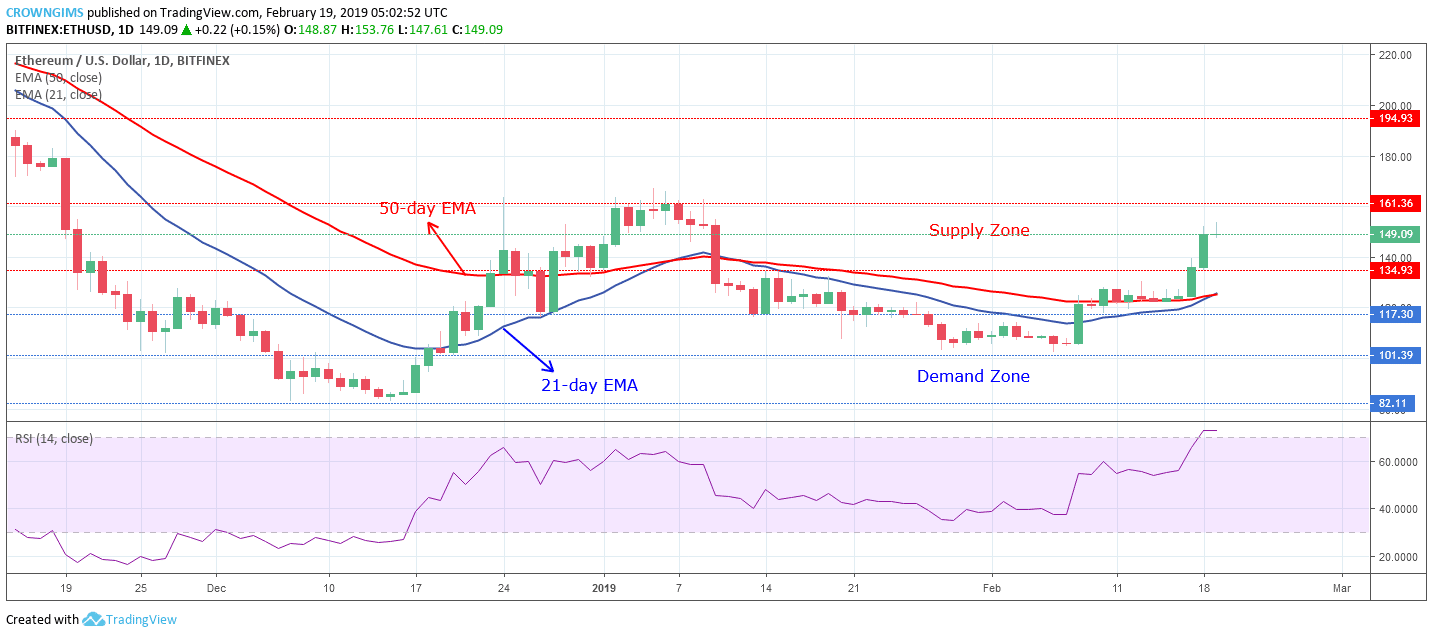
The two EMAs are closing at the tip end denotes that 21-day EMA is crossing the 50-day EMA upside to establish the uptrend movement in the ETH market. Nevertheless, the relative strength index period 14 is above 70 levels and its signal line horizontally placed indicating indecision as the doji candle may likely form.

In case the previous high of $161 price level is breached by the bulls, Ethereum price may have its target at $194 supply zone. On the other hand, should the bears defend the $161 price level; ETH price will fall towards $134 – $117 price level.

ETH/USD Medium-term Trend: Bullish

On the 4-Hour chart, Ethereum price is still on the bullish trend. The Bulls hold tight to the ETH market on the 4-Hour chart since last week and the ETH price is steadily increasing. The Bulls increased their pressure with the formation of more strong bullish candles that broke up the supply zone of $134 and the coin is increasing towards the supply zone of $161.

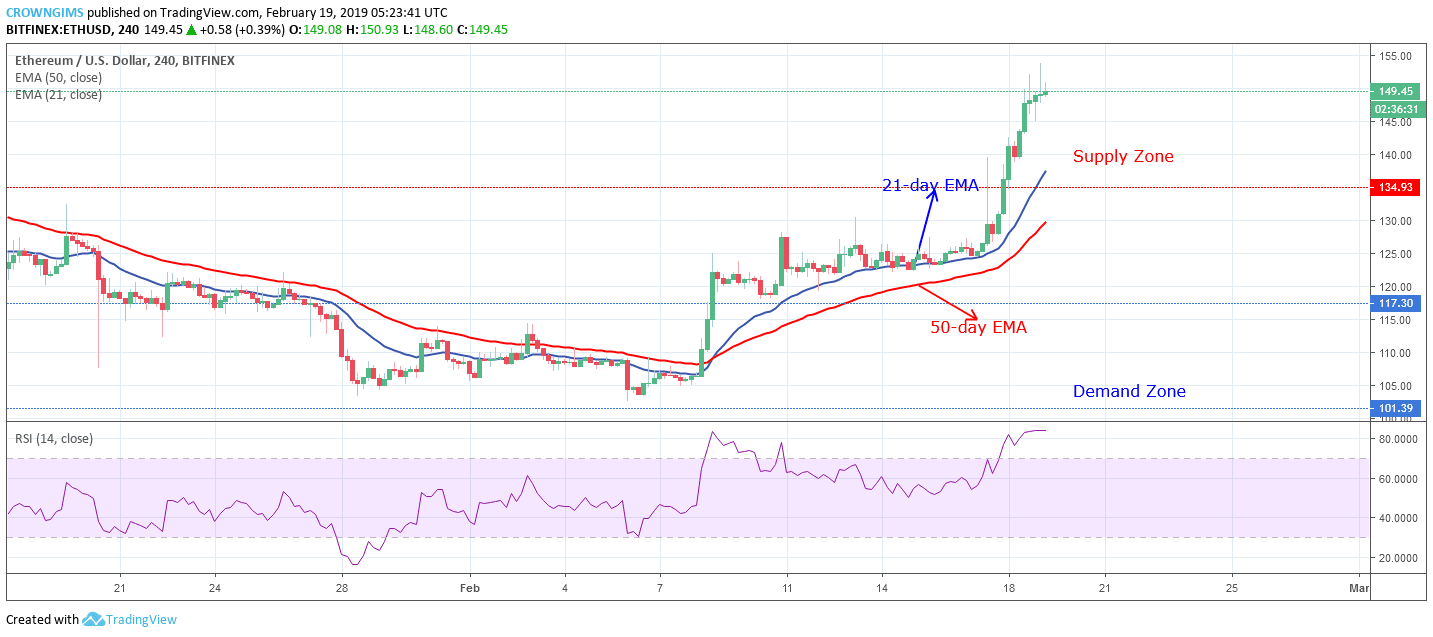
The 21-day EMA and the 50-day EMA is steep upside which connotes the strong bullish momentum in the ETH market on medium-term. The relative strength index period 14 is above 80 levels (overbought level) and its signal line pointing up indicates buy signal and a further increase in Ethereum price.

Share:

Related Articles

Layer 2s Now Handle 85% of All Transactions, Dune Report Says

By July 14th, 2025

According to a new report from Dune Analytics, over 85% of transactions now occur on Layer 2s, though Ethereum’s mainnet continues to settle the vast majority of all value transferred.

No Competition with Bitcoin, Ethereum to $1.5M?

By July 14th, 2025

Bitwise CEO Hunter Horsley said that Ethereum is not competing with Bitcoin, but replacing outdated Web2 and financial systems.

BlackRock Ethereum ETF Eyes $6 Billion Inflows as ETH Price Eyes $3,000 Breakout

By July 10th, 2025

Spot Ethereum ETFs recorded over $211 million in inflows on Wednesday, the highest in a month, with BlackRock leading as ETH price eyes a breakout above $3,000.

Exit mobile version