Ethereum Price Analysis: ETH/USD Trends of January 29–February 04, 2019

Updated on Apr 28, 2022 at 11:16 am UTC by · 2 min read

Should the demand level of $101 hold, Ethereum price may bounce, rally to the north and have its resistance at $131supply level, if not, ETH price will fall further and may find its support at the demand level of $85.

Key Highlights:

  • Ethereum price broke out of consolidation;
  • the bears were still in control of the ETH market;
  • further declination of Ethereum price is possible.

ETH/USD Long-term Trend: Bearish

Supply levels: $115, $131, $146
Demand levels: $101, $85, $74ETH/USD continues in its bearish trend on the long-term outlook. At the earlier part of last week, Ethereum price was ranging in-between the supply level of $131 and $115. Later, the bearish momentum increased and the ETH price penetrated the former demand level of $115 and dropped at $101 demand level. There is a possibility for the bears to still hold onto the ETH market as more strong bearish Japanese candles are emerging.

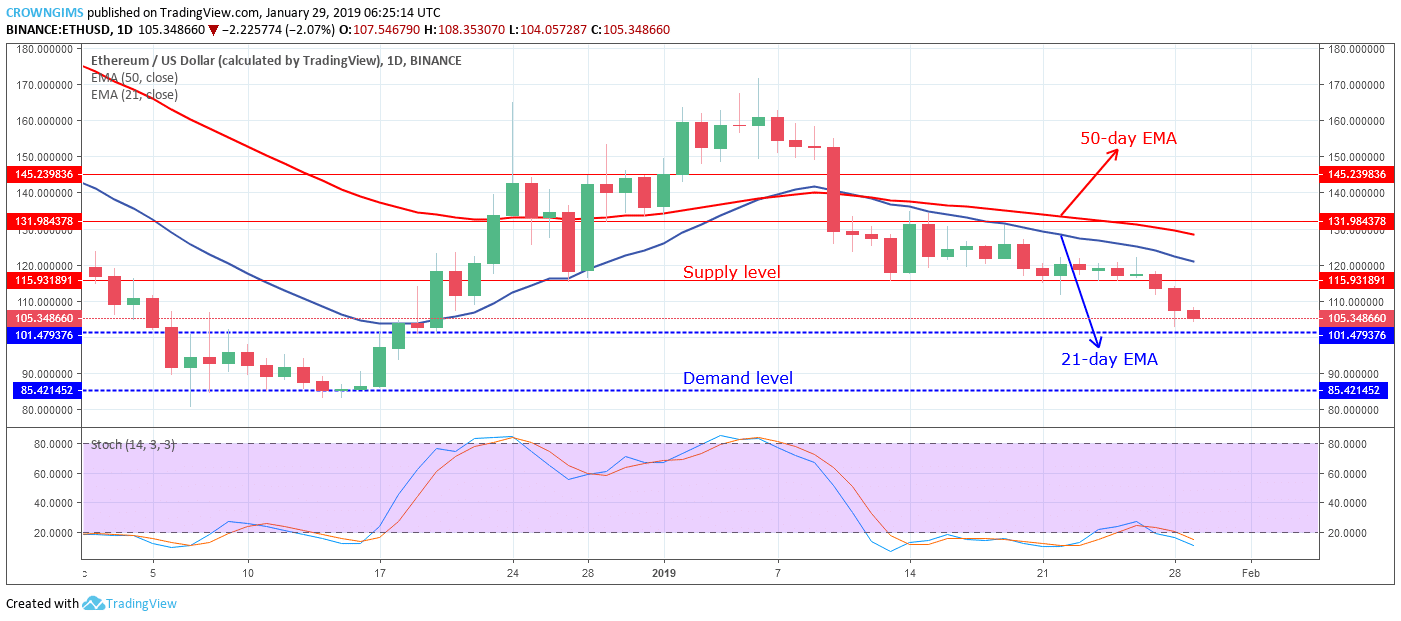
The 50-day EMA remains above the 21-day EMA as a sign of downtrend while Ethereum price is trading below the 21- day EMA. The stochastic Oscillator period 14 is below 20 levels (oversold level) with its signal lines points down which indicates that ETH price will still fall further and it may find its support at the demand level of $85 in case the demand level of $101 is broken downside. Should the demand level of $101 hold, Ethereum price may bounce, rally to the north and have its resistance at $131supply level.

ETH/USD Medium-term Trend: Bearish

On the medium-term outlook, ETH price continues a strong bearish trend. The Bearish pressure keeps on increasing on the ETH market on the 4-Hour chart, this is clearly seen as the former demand level of $115 is broken downside and the ETH price fell to the low demand level of $101 where it observed short pullback before continues its downward trend.

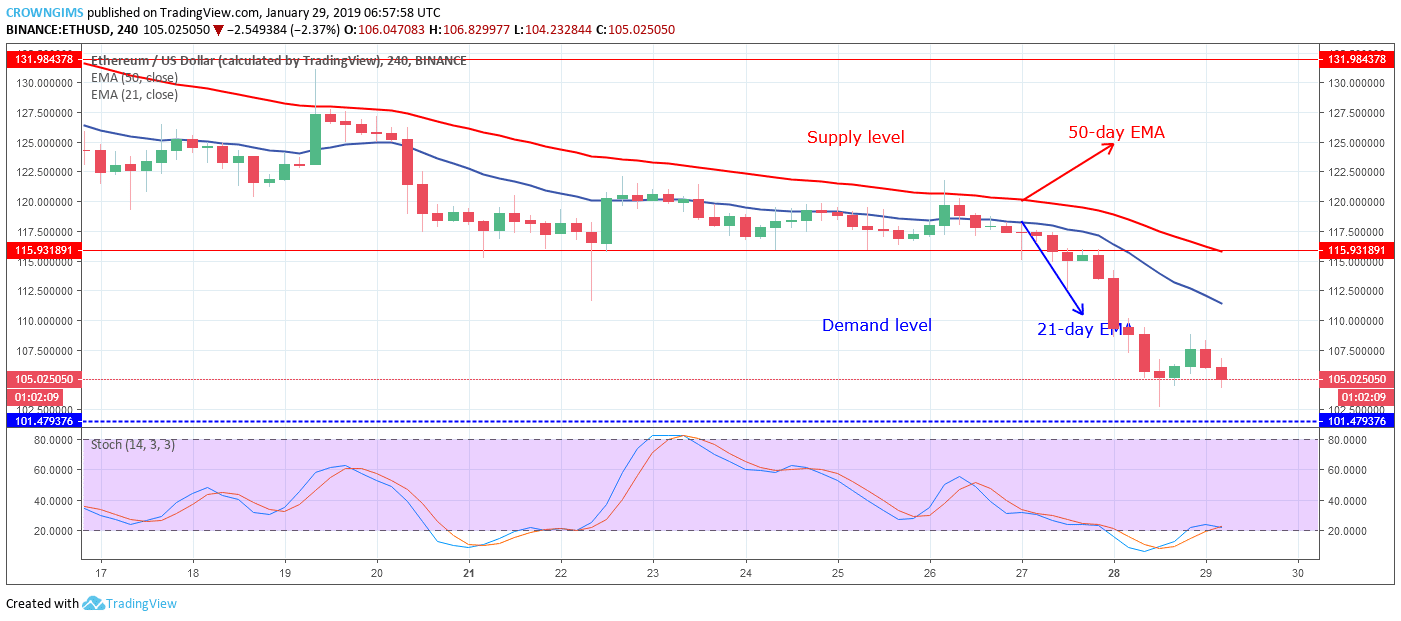
The two EMAs are pulling apart farther to confirm the increase in bears’ momentum. Ethereum price is below 21-day EMA and 50-day EMA. Moreover, the Stochastic Oscillator period 14 is on the 20 levels (oversold level) with the signal lines pointing down on the level which indicate that ETH price will continue its downtrend movement which may penetrate $101 demand level and expose $85 price level.

Share:

Related Articles

Ethereum (ETH): Why $15,000 Might Not Happen in 2024 and Top 3 ETH Alternatives to Consider for 2500% ROI

By May 18th, 2024

Several blockchain platforms have emerged as promising contenders as investors seek alternatives to Ethereum.

Grayscale Halts Ethereum ETF amid $56M Injective Lock, BlockDAG’s Dashboard Upgrade Craze Sparks Crypto Whales Excitement

By May 17th, 2024

Explore BlockDAG’s upgraded dashboard, Injective’s staking surge, and Grayscale’s Ethereum ETF withdrawal. Key updates in the crypto world.

Coinbase Research Report Predicts Upside Surprise in Ethereum (ETH)

By May 17th, 2024

Coinbase said that the market is underestimating the odds and timings of a potential spot Ethereum ETF approval, thereby leaving sufficient space for upside surprises. 

Exit mobile version