Ethereum Price Analysis: ETH/USD Making Up Golden Sell Opportunity

Updated on Apr 28, 2022 at 11:27 am UTC by · 2 min read

Increase in the bearish momentum will drop Ethereum price at the demand level of $131 in case $134 price level does not hold. Should the Bulls defend the demand level of $134; the ETH price may roll up towards the supply zone of $140.

Key Highlights:

  • The Bears took over ETH market at $140 price level;
  • Ethereum price may reach $131 level;
  • price retracement is inevitable in a trending market.

ETH/USD Medium-term Trend: Bearish

Supply Zones: $136, $140, $143
Demand Zones: $134, $131, $128The Crypto is on the bearish trend on the medium-term outlook. The coin was on consolidation phase a few days ago but now bearish. The bears’ momentum broke down the former demand zone of $140 with a strong bearish Japanese candle that dropped Ethereum price at $136 level. The coin carried out retracement back to the broken level and the bearish trend continues which bottomed the ETH price at the demand level of $134 after penetrated $136.

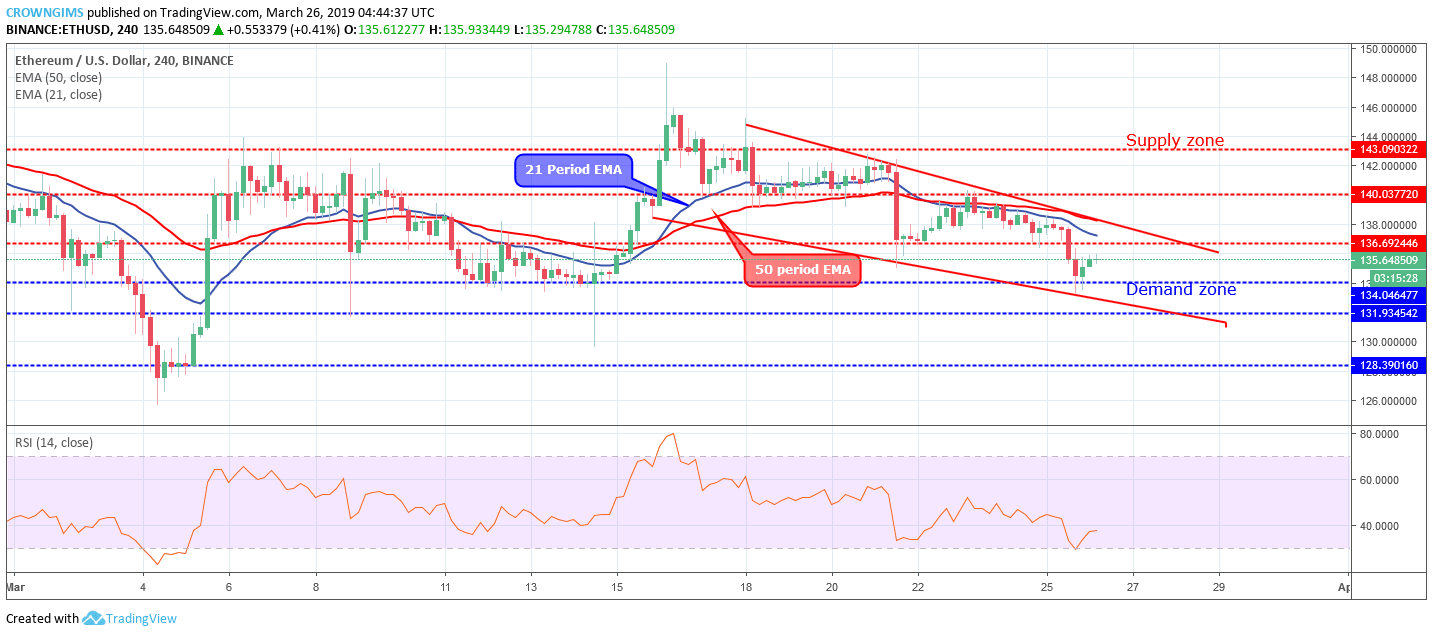
Ethereum price is trading below the 21 periods EMA and 50 periods EMA and the two EMAs are gradually separating from each other as a sign of increase bearish momentum. The Relative strength Index period 14 is below 40 with the signal line bending down which indicate sell signal.

The price retracement is inevitable in a trending market. Increase in the bearish momentum will drop the price at the demand level of $131 in case $134 price level does not hold. Should the Bulls defend the demand level of $134; Ethereum price may roll up towards the supply zone of $140.

ETH/USD Short-term Trend: Bearish

On the medium-term outlook, Ethereum price is bearish. Continuation of ETH price increment was rejected at the supply zone of $140 on March 22 by the bears and the barrier at the level. The bears’ pressure was noticed as the bearish engulfing candle emerged at the $140 price level and the ETH price dropped at $136, pulled back before it finally declined to the demand zone of $134 where it is currently pulling back.

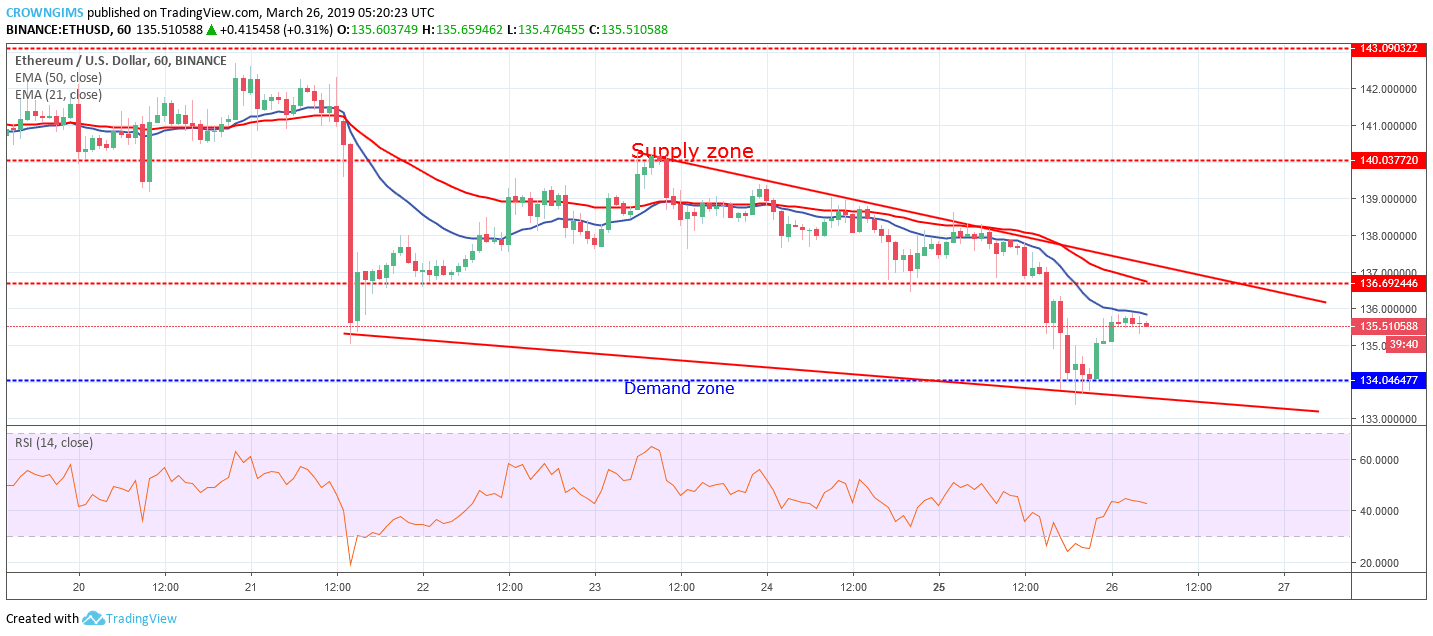
The two EMAs are separated from each other and the coin is found below 21 periods EMA and 50 period EMA. The RSI is around 40 levels about turning down to indicate sell signal.

Share:

Related Articles

Nomura Announces Partnership with GMO Internet Group to Launch Dollar and Yen Stablecoins in Japan

By May 27th, 2024

The collaboration will see Nomura try to launch stablecoins for the yen and the dollar to users in the Japanese market.

QCP Capital: No Major Breakout for ETH until S-1 Filings Are Approved

By May 27th, 2024

QCP noted that ETH rallied from $3,810 to $3,940 as investors in Asia woke up to bullish comments from the former US president and 2024 presidential candidate Donald Trump.

Ethereum Analysts Bullish on ETH Price, Point to Price Targets and Key Levels to Watch 

By May 27th, 2024

The price of Ethereum has continued its bullish momentum. It has increased by 3% in the last 24 hours, and 7% in the last three days.

Exit mobile version