
PENGU has seen a sharp correction amid broader meme market meltdown, but analysts suggest it may be gearing up for a major rally.
The fourth-largest meme coin by market cap, Pudgy Penguins’ native cryptocurrency PENGU PENGU $0.00700 24h volatility: 0.9% Market cap: $439.48 M Vol. 24h: $129.71 M , fell sharply today amid the broader crypto market downturn. At the time of writing, PENGU is trading at around $0.031, marking a 9% daily drop.
However, popular crypto analyst Ali Martinez believes this correction may be the best time to buy one of the top meme coins. Notably, PENGU has been forming a bullish flag channel on the 4-hour chart since August 9, a setup that often leads to major upward moves.
$PENGU is inches away from a new leg up — $0.10 next! pic.twitter.com/dlk4slbOrS
— Ali (@ali_charts) August 25, 2025
If confirmed, the token could rally as high as $0.10, representing a potential 300% gain.
PENGU Price at Crossroads
PENGU saw a major price rally between April and mid-July, surging around ten times during this time. However, since then, it has been consolidating inside a descending channel that began in mid-July.
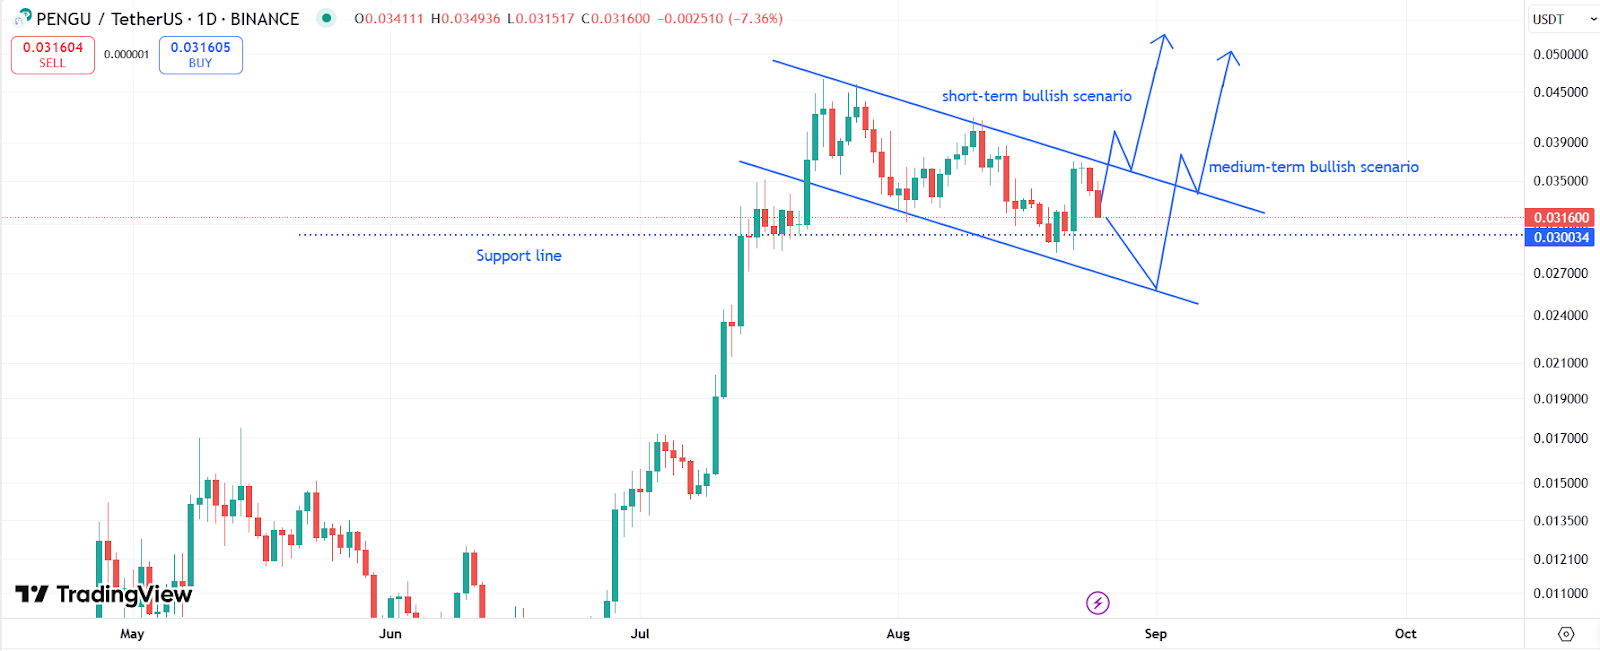

PENGU is currently testing the $0.030 support zone, which also aligns with a broader $0.025–$0.030 demand range. If the cryptocurrency fails to hold above $0.030, the next key support lies at $0.025, which could lead to further downside.
According to the data by CoinMarketCap, PENGU price is down 25% in the past month, losing over $700 million in market cap.
If the meme coin manages to break out from this descending channel, traders should watch for immediate resistance at $0.0403. A decisive close above this level will confirm the beginning of a new uptrend.
The RSI is currently indicating neutral conditions on the daily chart. PENGU’s overall price action currently depends on the $0.030 support zone. Holding above this level could confirm a breakout toward $0.046 and beyond, while failure risks a drop to $0.025.

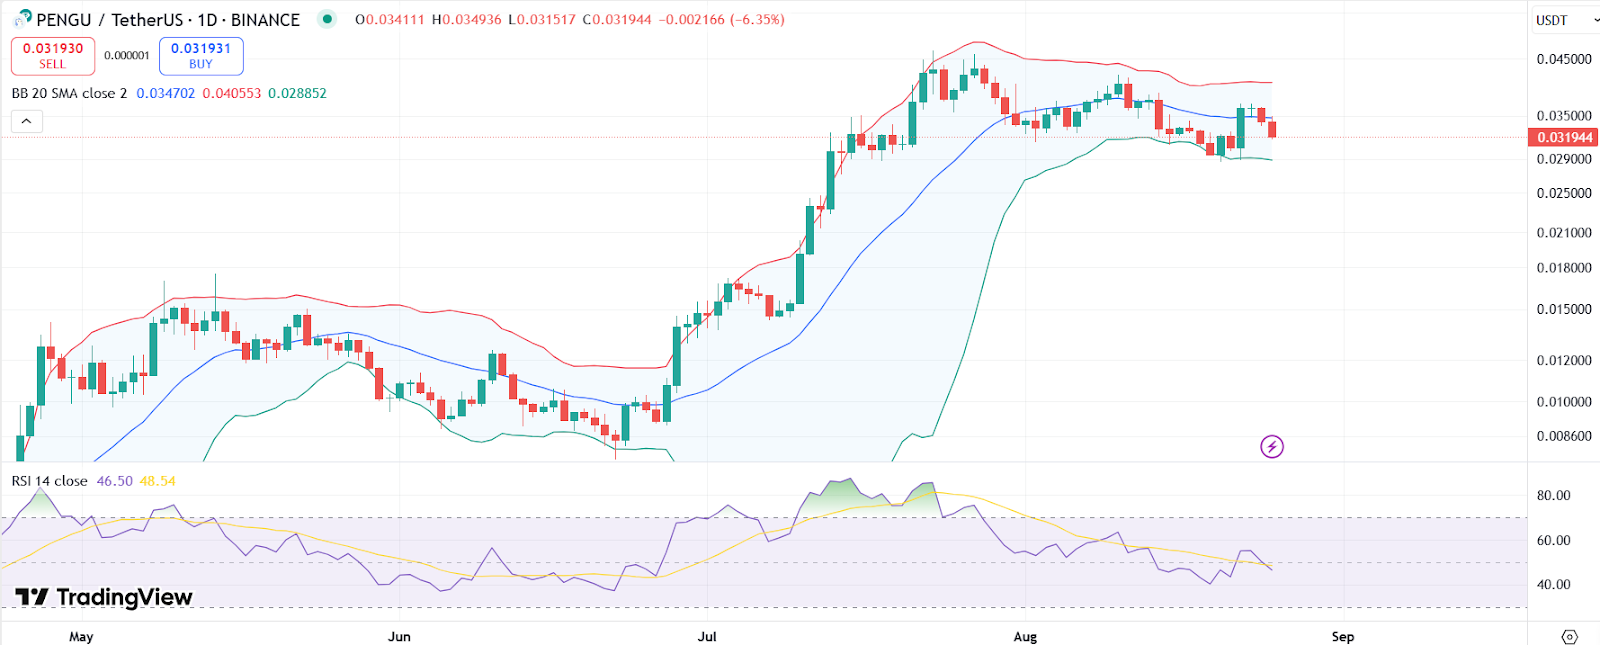
PENGU price chart with RSI and Bollinger | Source: TradingView
The price is approaching the lower Bollinger Band, which often points to a potential rebound if buyers defend this level. However, persistent weakness could see the meme coin drifting even lower.

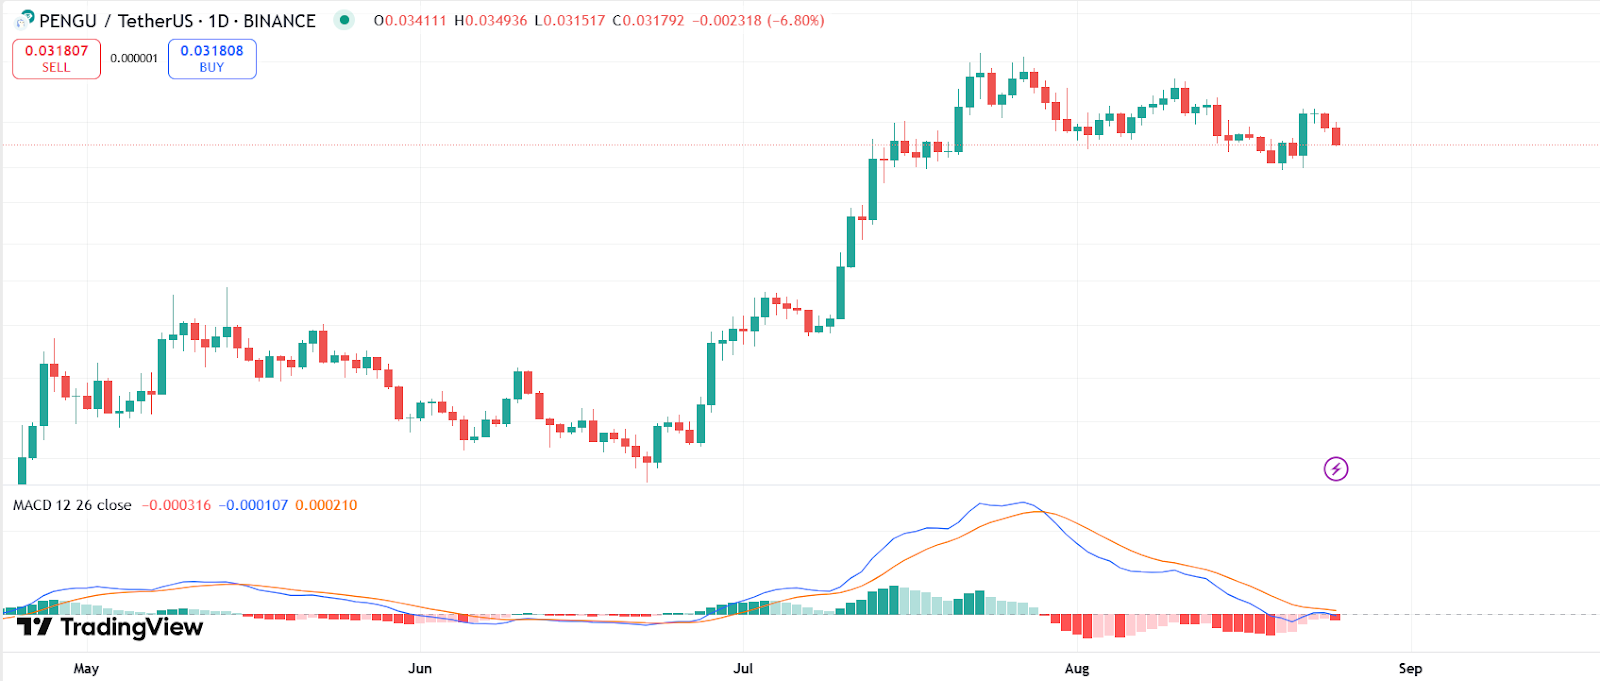
PENGU price chart with MACD | Source: TradingView
The MACD histogram shows red bars, with the signal line above the MACD line. This suggests bearish momentum is still present, but the line positions suggest a crossover could quickly shift the trend bullish.
next