
Should the price break the demand level of $0.24 the downtrend movement will be experienced and this will expose it to another demand level of $0.21.
Key Highlights:
- Downtrend movement may be experienced;
- there is a possibility of further consolidation;
- traders should patiently watch out for the breakout.
XLM/USD Long-term Trend: Ranging
Supply levels: $0.30, $0.35, $0.45
Demand levels: $0.24, $0.21, $0.18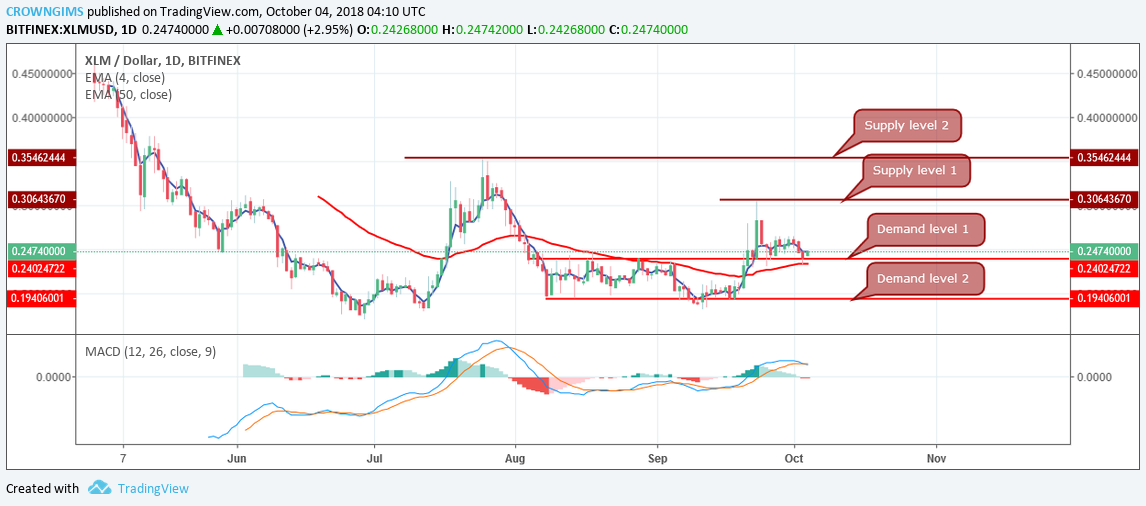

XLM/USD enters consolidation in its short-term outlook. After a bearish run to the demand level of $0.24, rejection to the further downward movement was seen with the formation of a pin bar and a bullish candle as the bulls made a gradual return.
The price is below 4-day EMA and the 50-day EMA is below the price that suggests a continuation of sideways movement. However, the MACD indicator is above zero level with its signal lines pointing to the south which indicate selling signal and this is also supported by the opening bearish candle formed on the daily chart at the demand level of $0.24. In case the bears increase the momentum the price would break the demand level of $0.24 and expose to the demand level of $0.21.
XLM/USD Price Medium-term Trend: Ranging
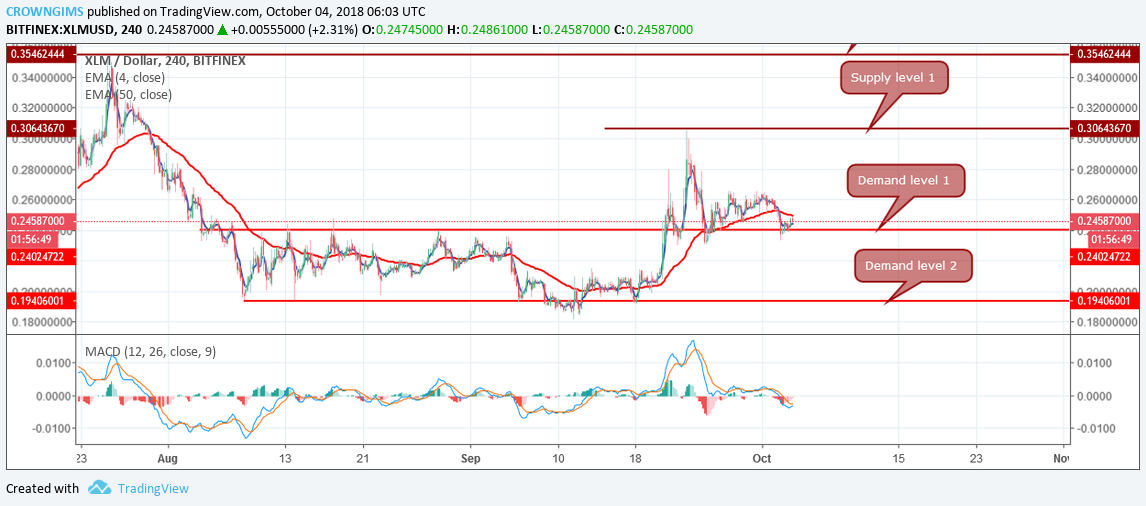
The Bulls and the Bears could not increase their momentum to rally to the supply level of $0.3 and to break the demand level of $0.24 respectively and it started moving sideways.
Should the price break the demand level of $0.24 the downtrend movement will be experienced and this will expose it to another demand level of $0.21. The price is between 4-day EMA and 50-day EMA while 50-day EMA is above the price, with the MACD below zero and its signal lines point to the north indicates the possibility of the uptrend movement. Traders should patiently watch out for the breakout.
next