Tron Price Analysis: TRX/USD Trends of November 6–12, 2018

On Nov 6, 2018 at 7:38 am UTC by · 2 min read

Should the resistance level of $0.024 breaks by the bulls, Tron price will rally to the north and $0.025 resistance level will be the next target.

Key Highlights:

  • Tron price may increase;
  • bulls were in control of the market;
  • there may be price retracement.

TRX/USD Price Long-term Trend: Bullish

Resistance levels: $0.024, $0.025, $0.028
Support levels: $0.023, $0.022, $0.021TRX price resumes its bullish trend movement on the long-term outlook. The Bulls return to the Tron market was clearly seen after the formation of a doji candle at the support level of $0.022. The next candle that closed above the support level of $0.022 as the bullish engulfing candle confirm the bulls pressure. Bulls gained momentum and led to the broken of last week resistance levels of $0.022, $0.023, $0.024. Last week, TRX price was gradually increased as the Bulls maintained their pressure.

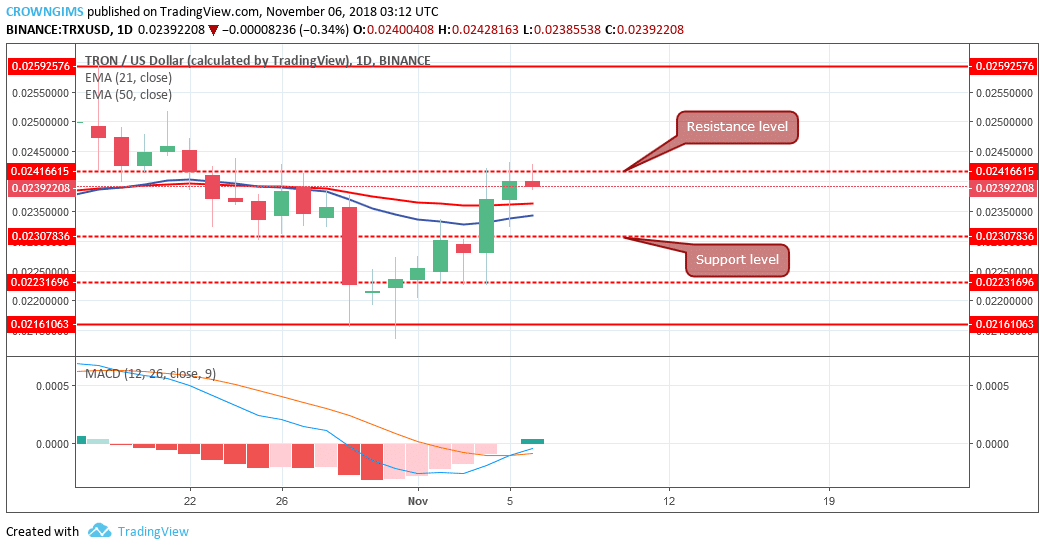
Tron price has broken the two EMAs that act as a dynamic support and resistance upside which is an indication of bulls taking over the TRX market. TRX price is increasing above the 21-day EMA and the 50-day EMA, an indication of bull’s pressure which means there is a probability for further increase of the TRX price.
Should the resistance level of $0.024 breaks by the bulls, TRX price will rally to the north and $0.025 resistance level will be the next target. Though, price pullback is inevitable in any trending market.

The MACD with its histogram, starting above the zero level and its signal lines points to the north on the daily chart indicating a buy signal.

TRX/USD Price Medium-term Trend: Bullish

TRX/USD on the 4-Hour chart is in bullish movement. The bullish engulfing candle formed at the support level of $0.022 indicate the bulls are in control of the market thus made the TRX rallied to the north and broke the last week resistance level of $0.023 up to the upper resistance level of $0.024.

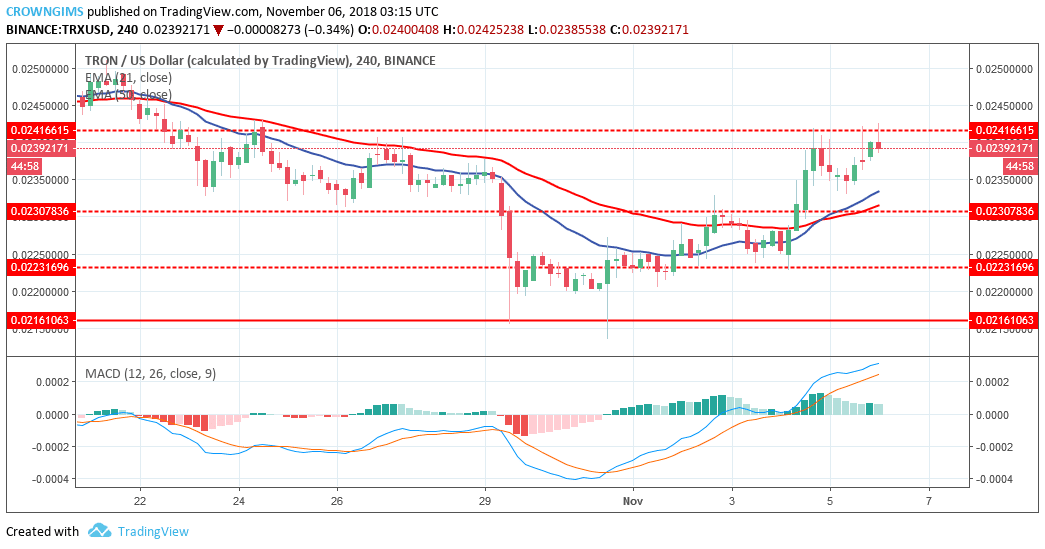
TRX price is above 21-day EMA and the 50-day EMA with 21-day EMA crossed 50-day EMA upside, indicates a continuation of uptrend movement.

There is a tendency for TRX price to break the resistance level of $0.024 upside as the MACD with its histogram is above zero level and its signal line pointing to the north.

Share:

Related Articles

Shiba Inu And Tron Holders Face Tough Times Amid Bearish Wave: Could This Be All Over After Buying Algotech Presale?

By April 22nd, 2024

Algotech (ALGT) emerges as the best presale coin, leveraging algorithmic trading tactics to optimize investor returns.

Crypto Whales Bet Big on Raboo Presale Amid Predicted Dips for AVAX and TRX

By April 21st, 2024

As investor concern grows over the health of the crypto market amid dips in the Avalanche price and Tron value, crypto whales have shifted their attention to Raboo.

New Hybrid Exchange with 1000X Leverage Feature Attracts BNB & TRON Investors

By April 19th, 2024

The cryptocurrency industry is a thriving space for innovation and the continuous emergence of projects is a testament to this.

Exit mobile version